Analytics
The Analytics page embeds Grafana dashboards directly into Reveal, giving you a live view of your metrics — platform usage, system health, business KPIs, or any dashboard your Grafana instance serves — without leaving the application.
Opening Analytics
Click Analytics in the left navigation. The page shows two tabs: Dashboards and Settings.
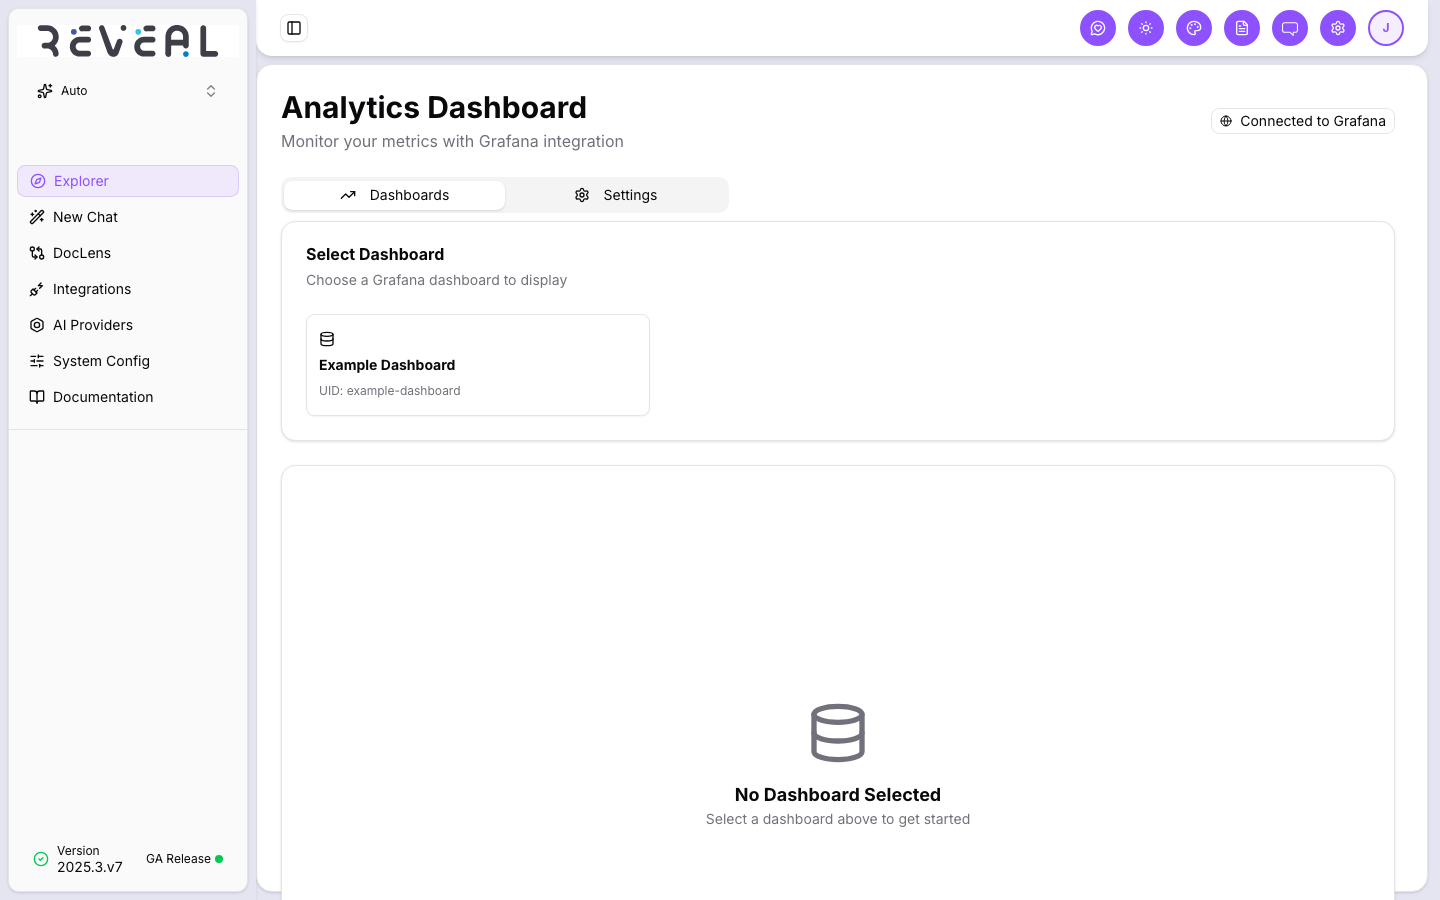
A Connected to Grafana badge in the top right confirms the integration is active.
Selecting a dashboard
On the Dashboards tab, the Select Dashboard panel lists all available Grafana dashboards by name and UID. Click a dashboard tile to load it in the viewer below.
Once selected, the dashboard renders as a live embedded Grafana view — all panels, charts, and tables update in real time according to the configured refresh interval.
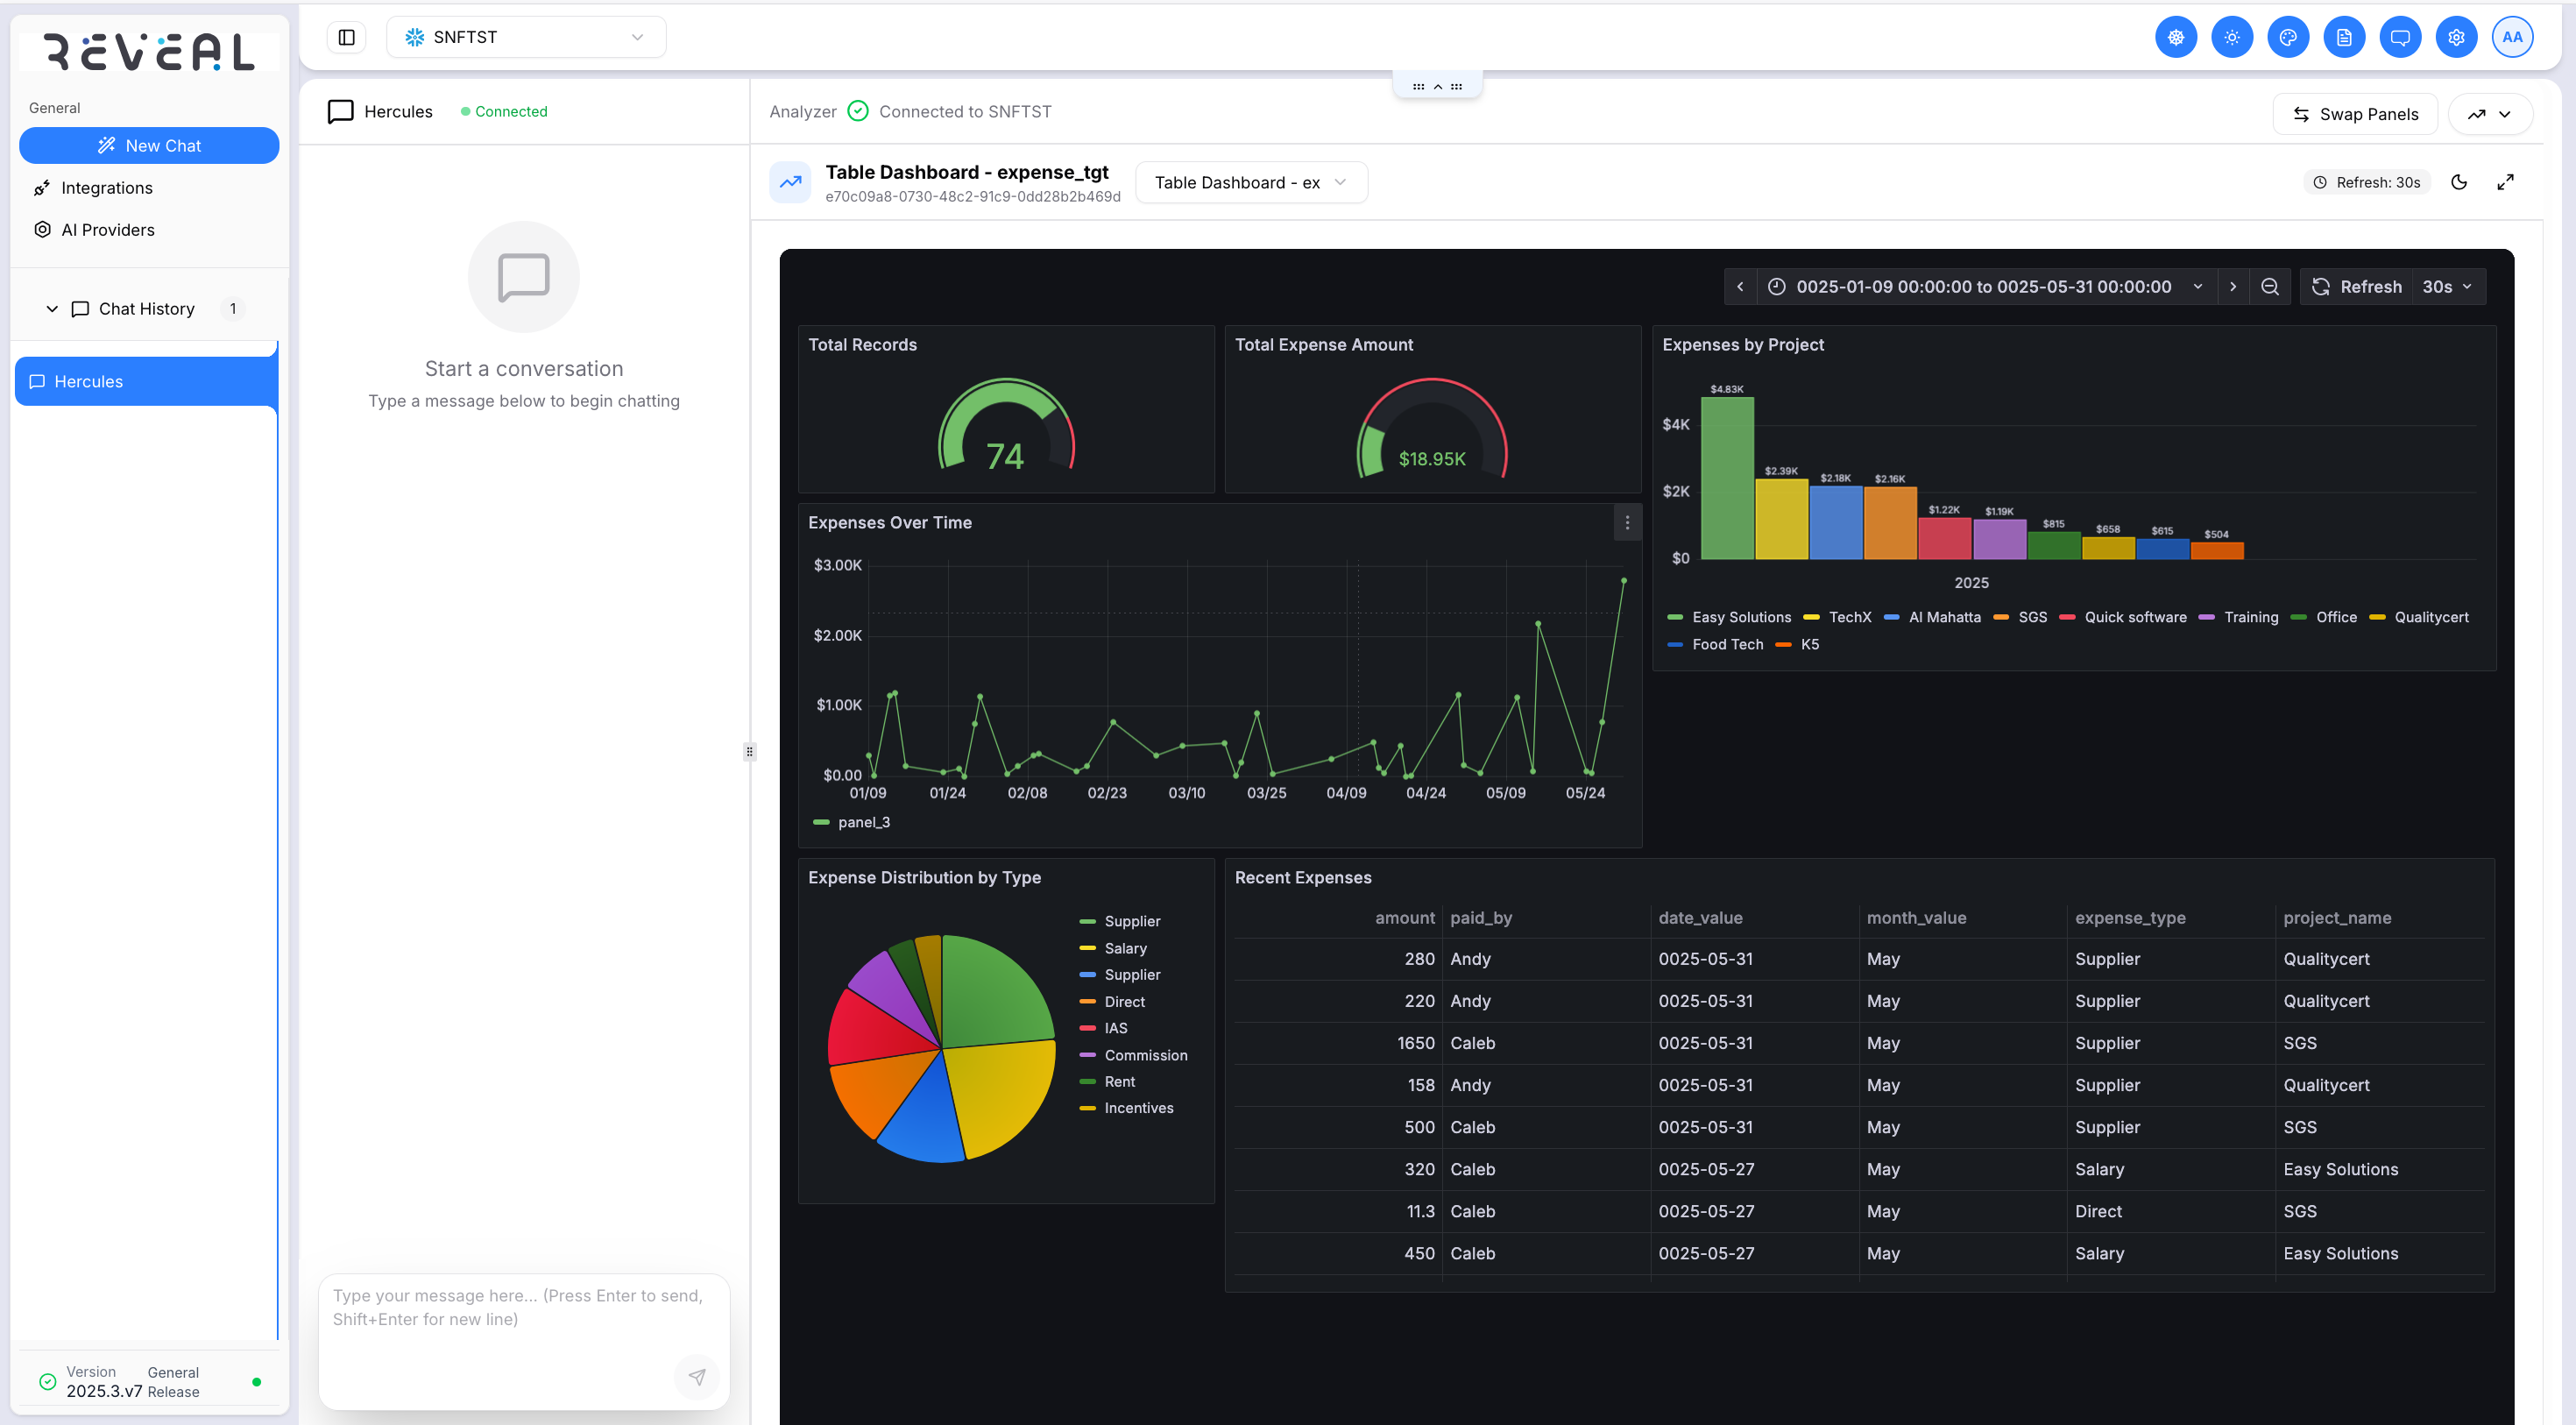
The embedded dashboard includes the full Grafana panel set for that dashboard — for example, gauge panels for totals, bar charts for category breakdowns, line charts for trends over time, and data tables for detailed records.
Dashboard controls
Within the embedded view, you can:
- Refresh — reload the dashboard data manually using the refresh button
- Open in new tab — open the dashboard directly in Grafana in a new browser tab
- Fullscreen — expand the dashboard to fill the page; click again to minimise
Settings tab
The Settings tab lets you configure how the dashboard is displayed:
Grafana Configuration
- Dashboard URL — the base URL of the Grafana dashboard to display
- Theme — choose Light or Dark to match your Reveal theme
Time Range Set the time window for the dashboard data:
- From and To fields (e.g.
now-6htonow) - Quick range buttons: Last 5m, Last 1h, Last 6h, Last 24h
Refresh Interval How often the dashboard automatically reloads:
- 5 seconds, 10 seconds, 30 seconds, 1 minute, 5 minutes, or No refresh
Dashboard Variables Pass filter variables into the dashboard to scope the data shown — for example, filtering by server, environment, or region. Add a variable name and value and click Add Variable. Active variables appear as removable badges. These map directly to Grafana template variables on the selected dashboard.
Admin configuration
Grafana integration is configured by an administrator in System Config:
| Setting | Purpose |
|---|---|
analytics.grafana_url | Base URL of your Grafana instance |
analytics.grafana_token | Service account token with viewer access |
analytics.dashboard_uid | Default dashboard UID to display on load |
Analytics requires a Grafana instance that is reachable from your Reveal deployment. If the Connected to Grafana badge is not shown, ask your administrator to configure the connection in System Config.