Data Explorer
Data Explorer lets you ask questions about your business data in plain language — no SQL required. Type a question, and Reveal figures out which tables to query, runs the query, and gives you a clear answer with charts, tables, and insights.
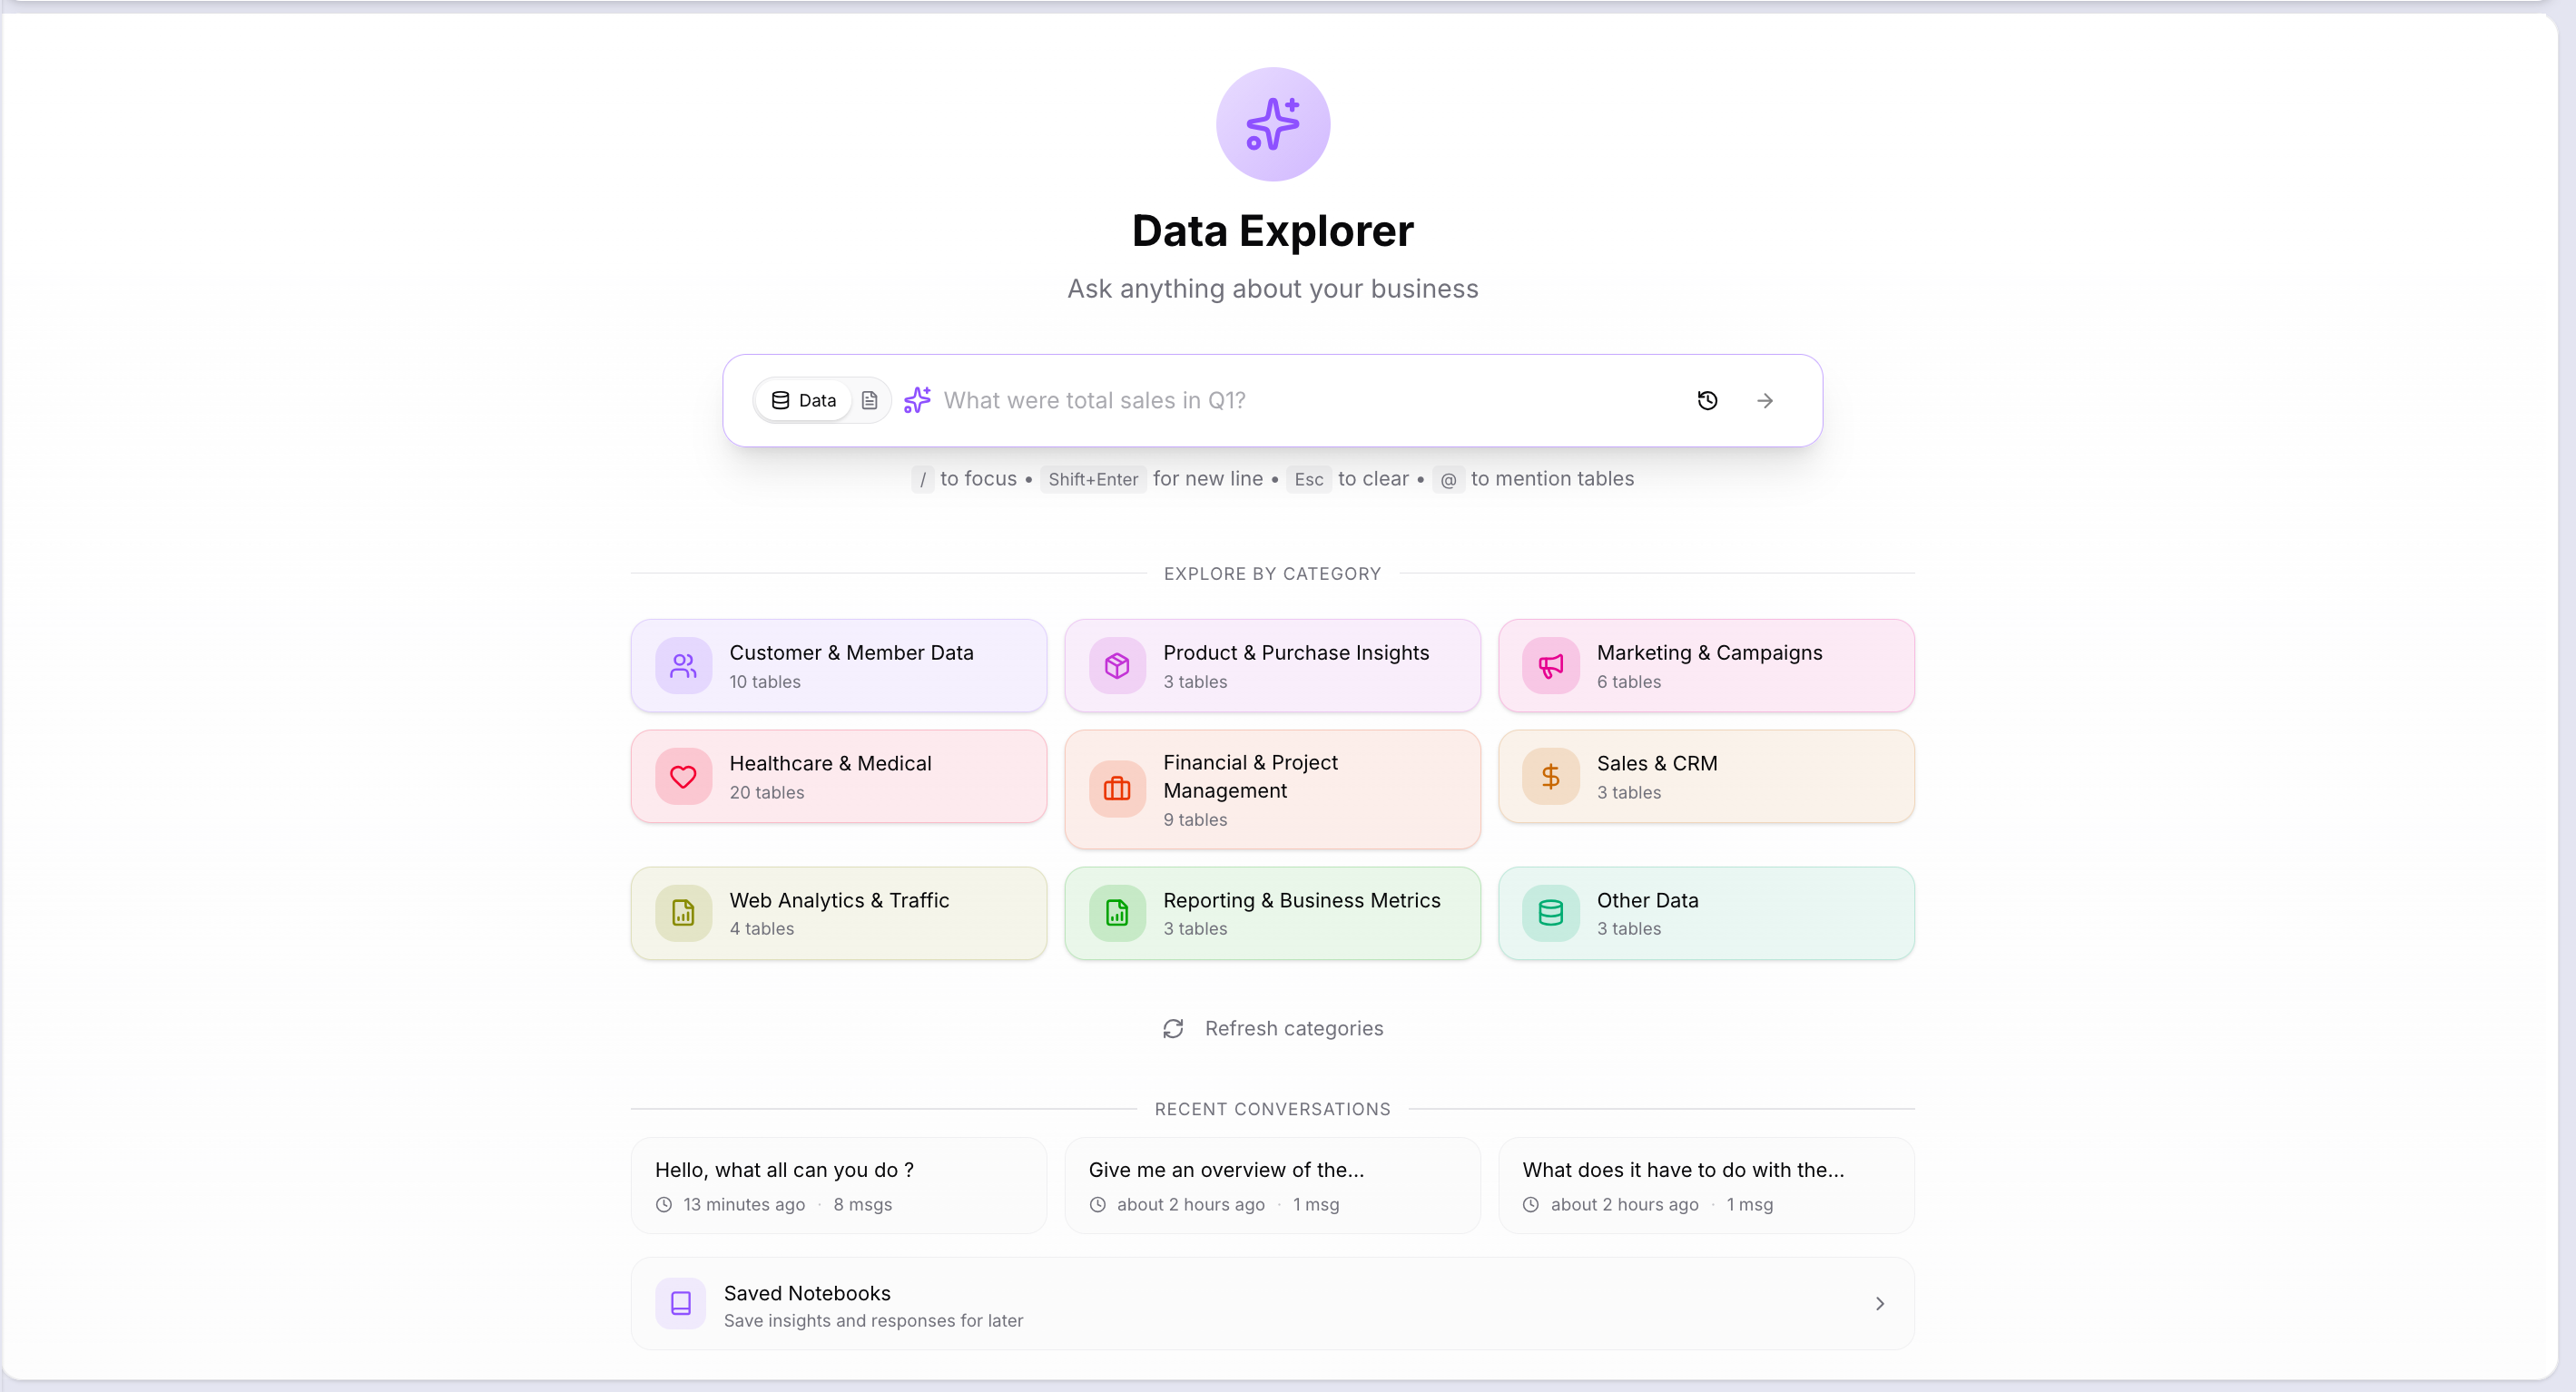
The home screen
When you open Data Explorer, you see your connected data organised into category bubbles — groupings of related tables by business domain, such as Customer & Member Data, Sales & CRM, Financial & Project Management, or Web Analytics & Traffic. Each bubble shows how many tables it covers.
Click a category to explore it. Reveal shows the key metrics and business terms for that area, along with suggested questions you can click to get started immediately.
Recent Conversations at the bottom of the home screen show your three most recent sessions. Click any of them to pick up where you left off, or click View all conversations to see the full history.
Asking a question
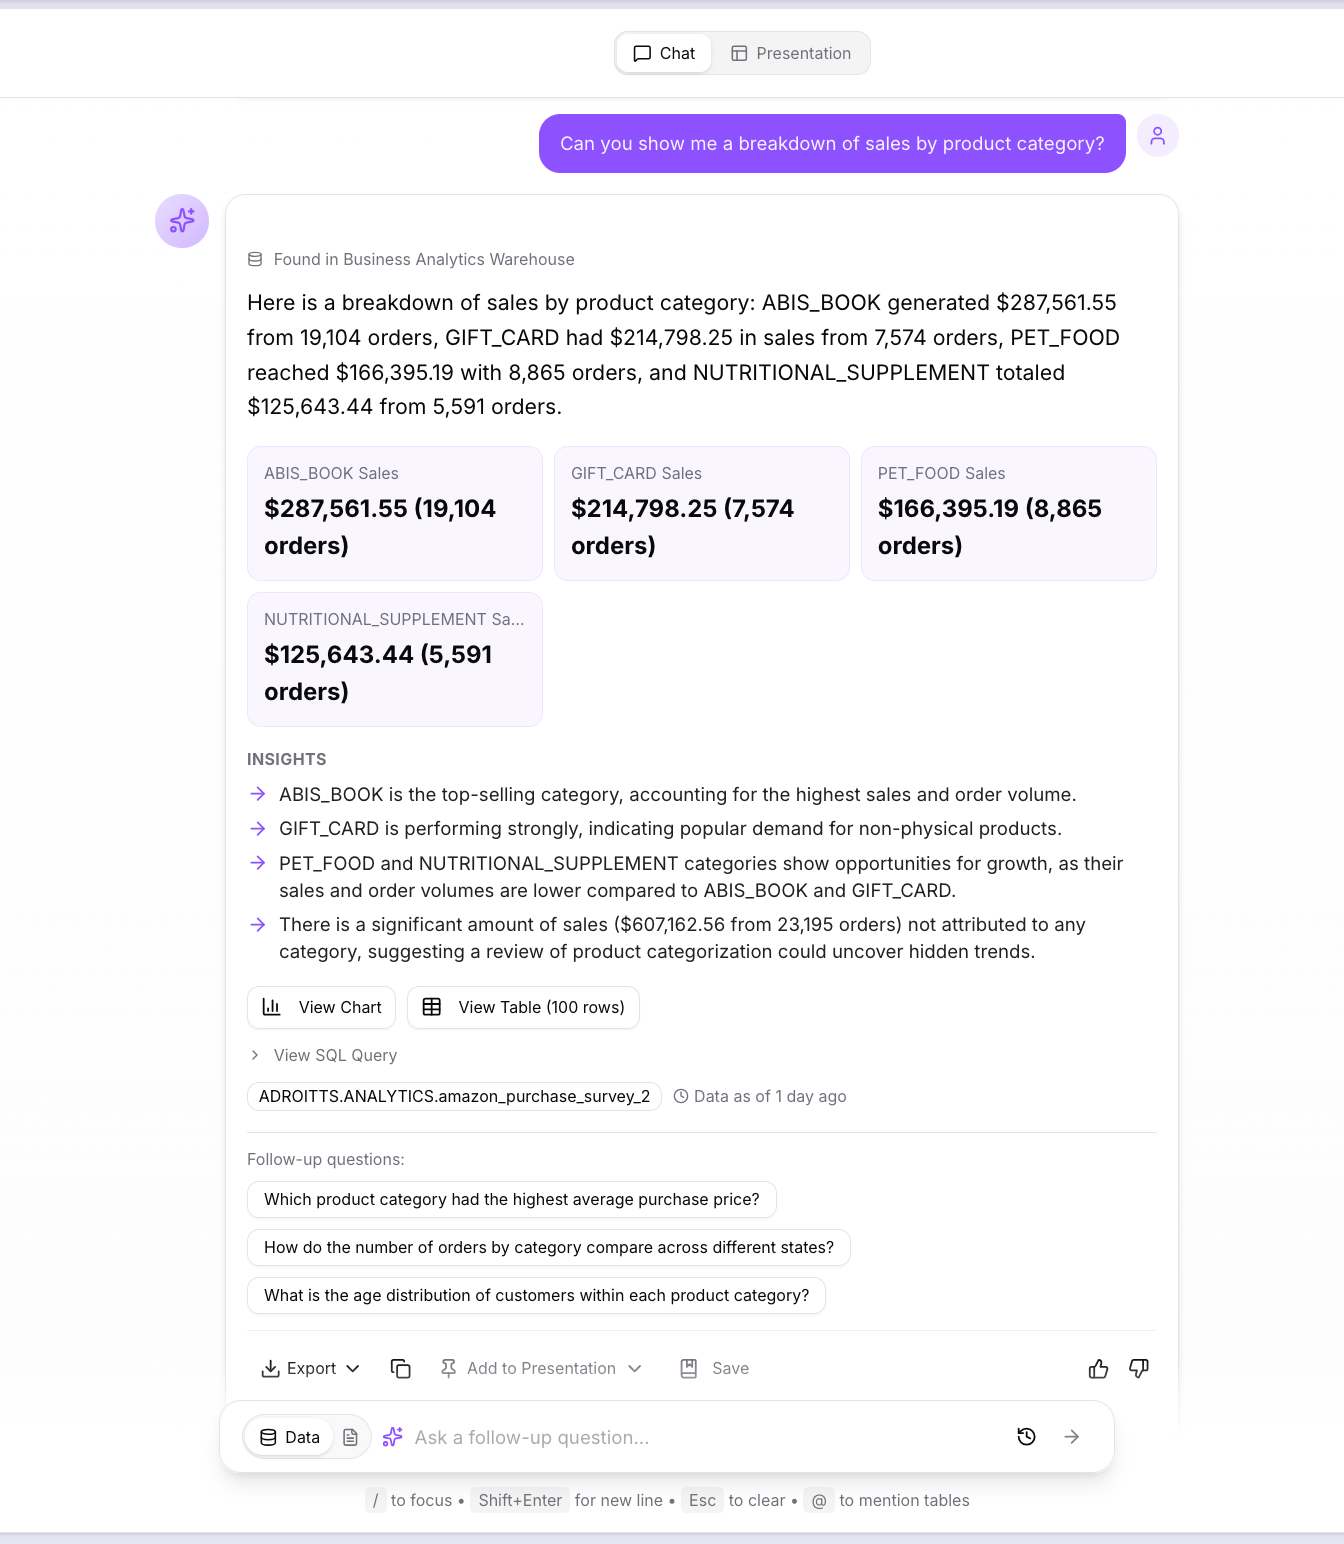
Type your question in the search bar and press Enter. You can ask in plain English — for example, "Can you show me a breakdown of sales by product category?"
Reveal identifies the relevant tables, generates and runs the query, and returns a structured response that includes:
- Summary cards — the key figures from the result pulled to the top so you can scan the most important numbers at a glance
- Insights — AI-generated observations about the result, highlighting what stands out, what leads, and what is worth investigating
- Follow-up questions — suggested next questions at the bottom of the response, which you can click to keep exploring without typing
- Data source — a label confirming which connection and tables the answer was pulled from
- Data freshness — a timestamp showing how recent the underlying data is
Viewing charts
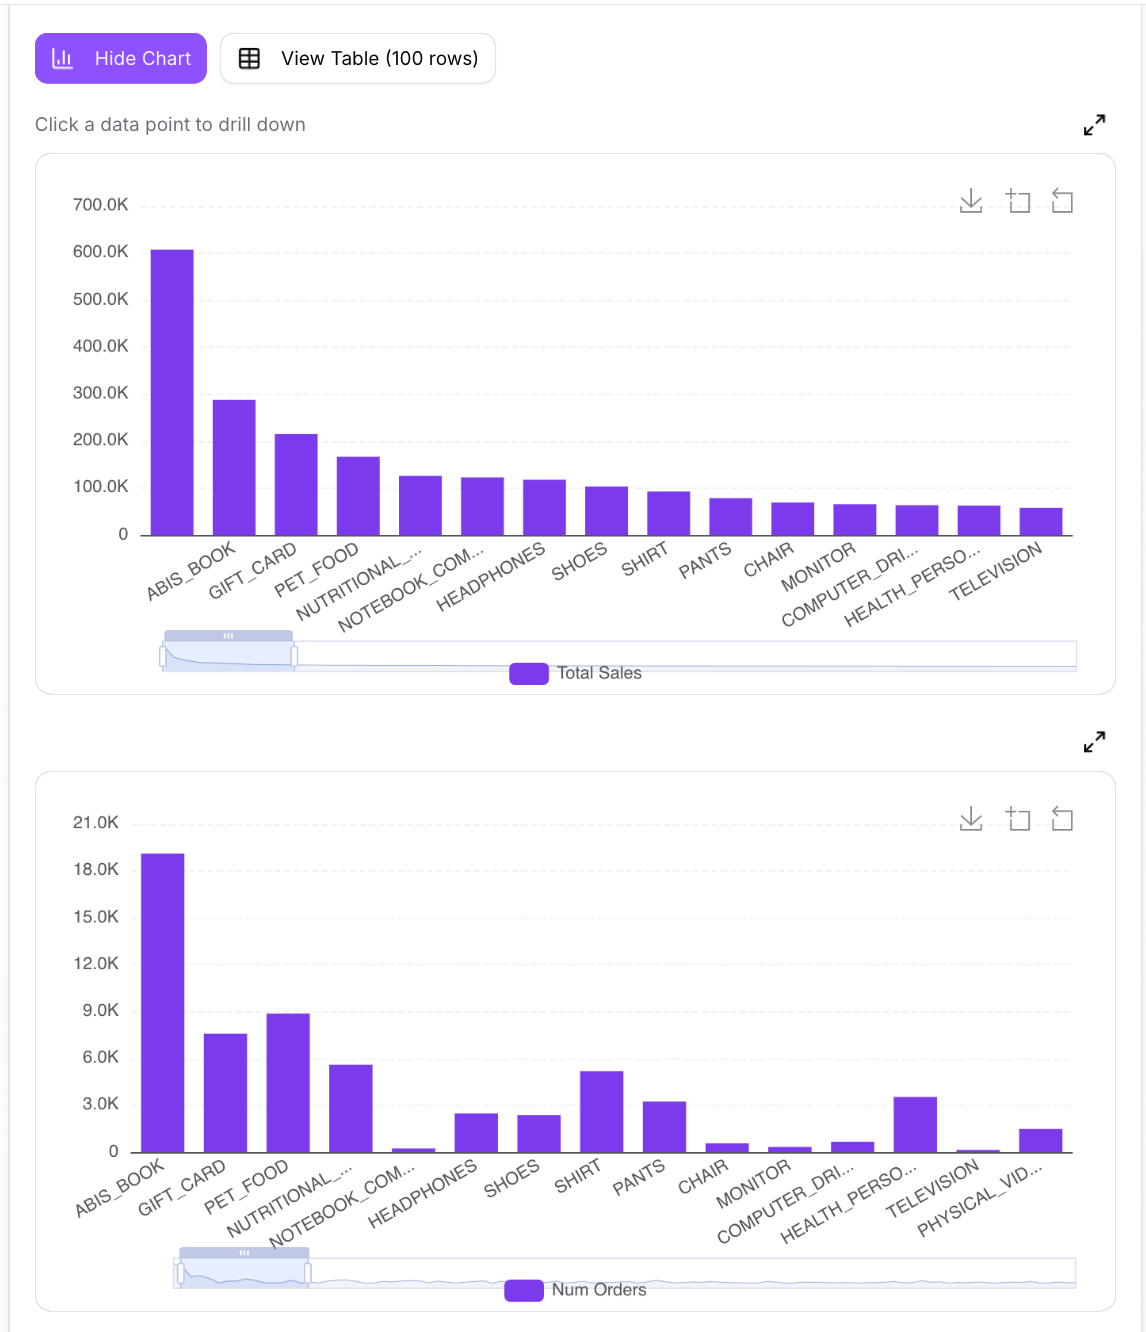
Every response that contains numeric data includes a View Chart button. Click it to switch from the summary view to a visual chart — bar chart, line chart, area chart, or pie chart, chosen automatically based on the shape of your data.
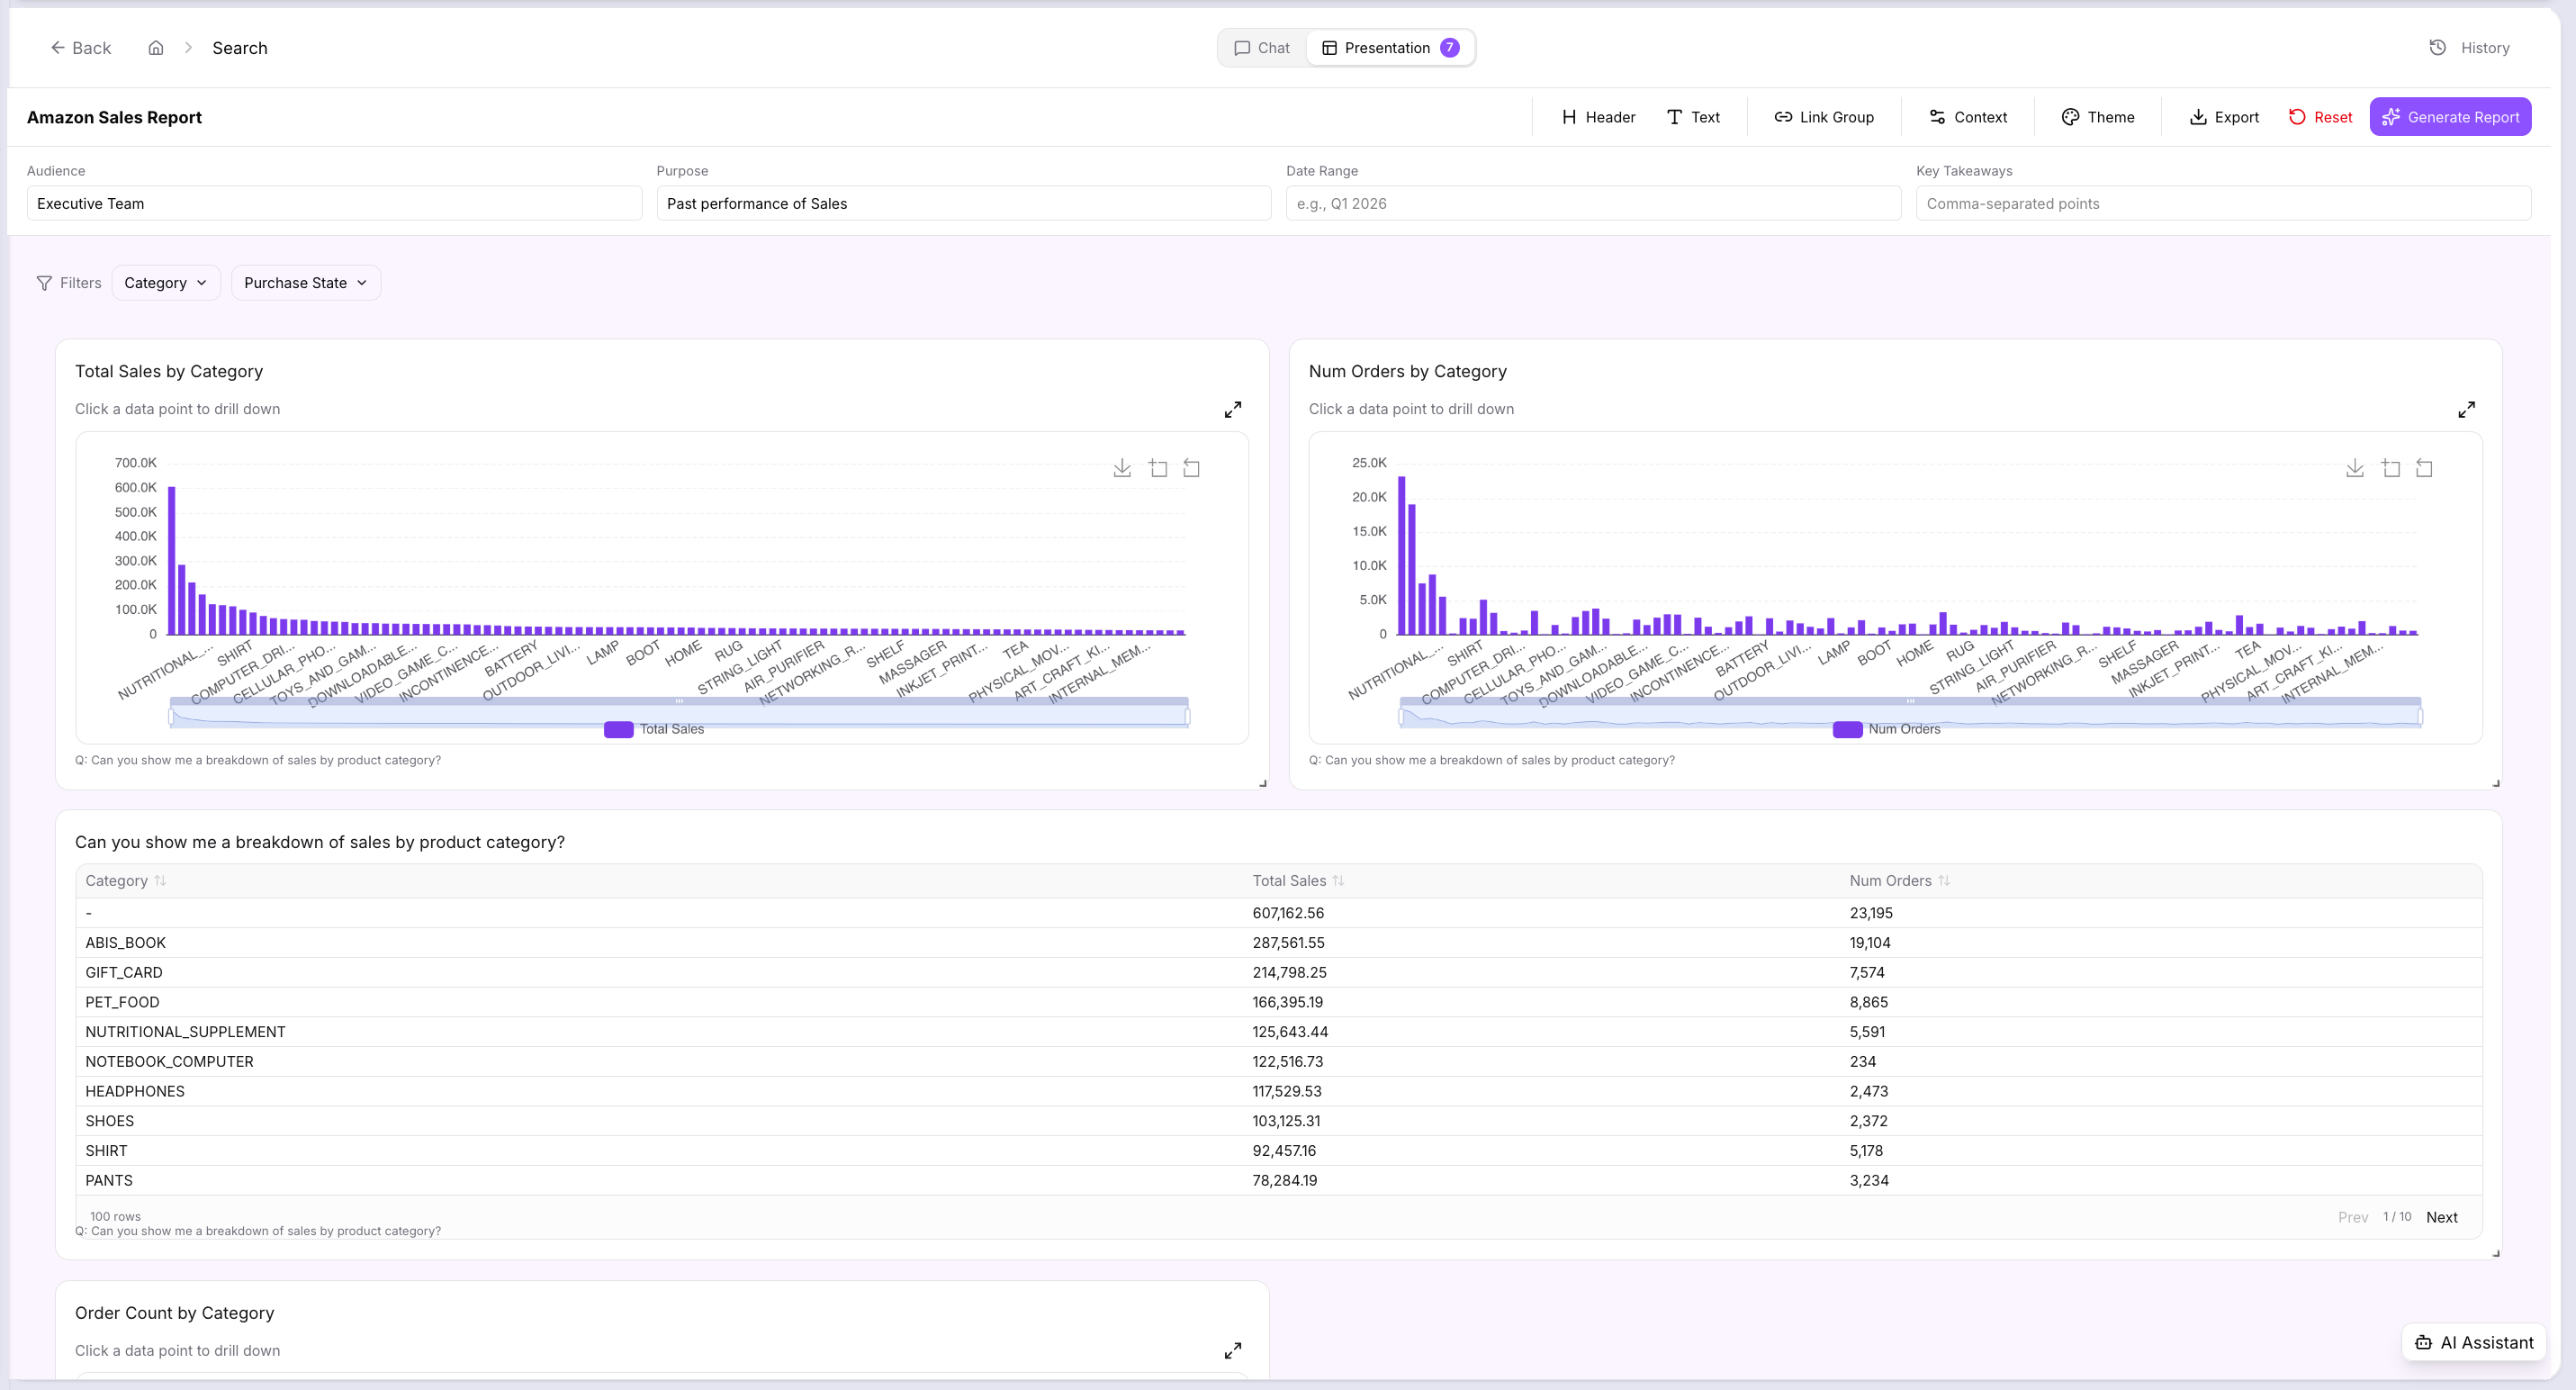
The example below shows the same sales breakdown rendered as two bar charts side by side — Total Sales by category and Number of Orders by category — so you can compare revenue and volume at the same time.
Drilling down: Click any bar, line point, or pie slice to drill into that segment. The clicked value is added as a filter chip below the search bar, and your next question will be scoped to that selection automatically.
Charts can be downloaded as PNG, expanded to full screen, or copied using the icons at the top right of each chart panel.
Viewing the data table
Click View Table to see the raw result set as a paginated, sortable table. Click any column header to sort. Click a row to drill into that record — the value is added as a filter chip for your next question.
Long values are truncated in the table view with a tooltip showing the full content on hover.
Viewing the SQL
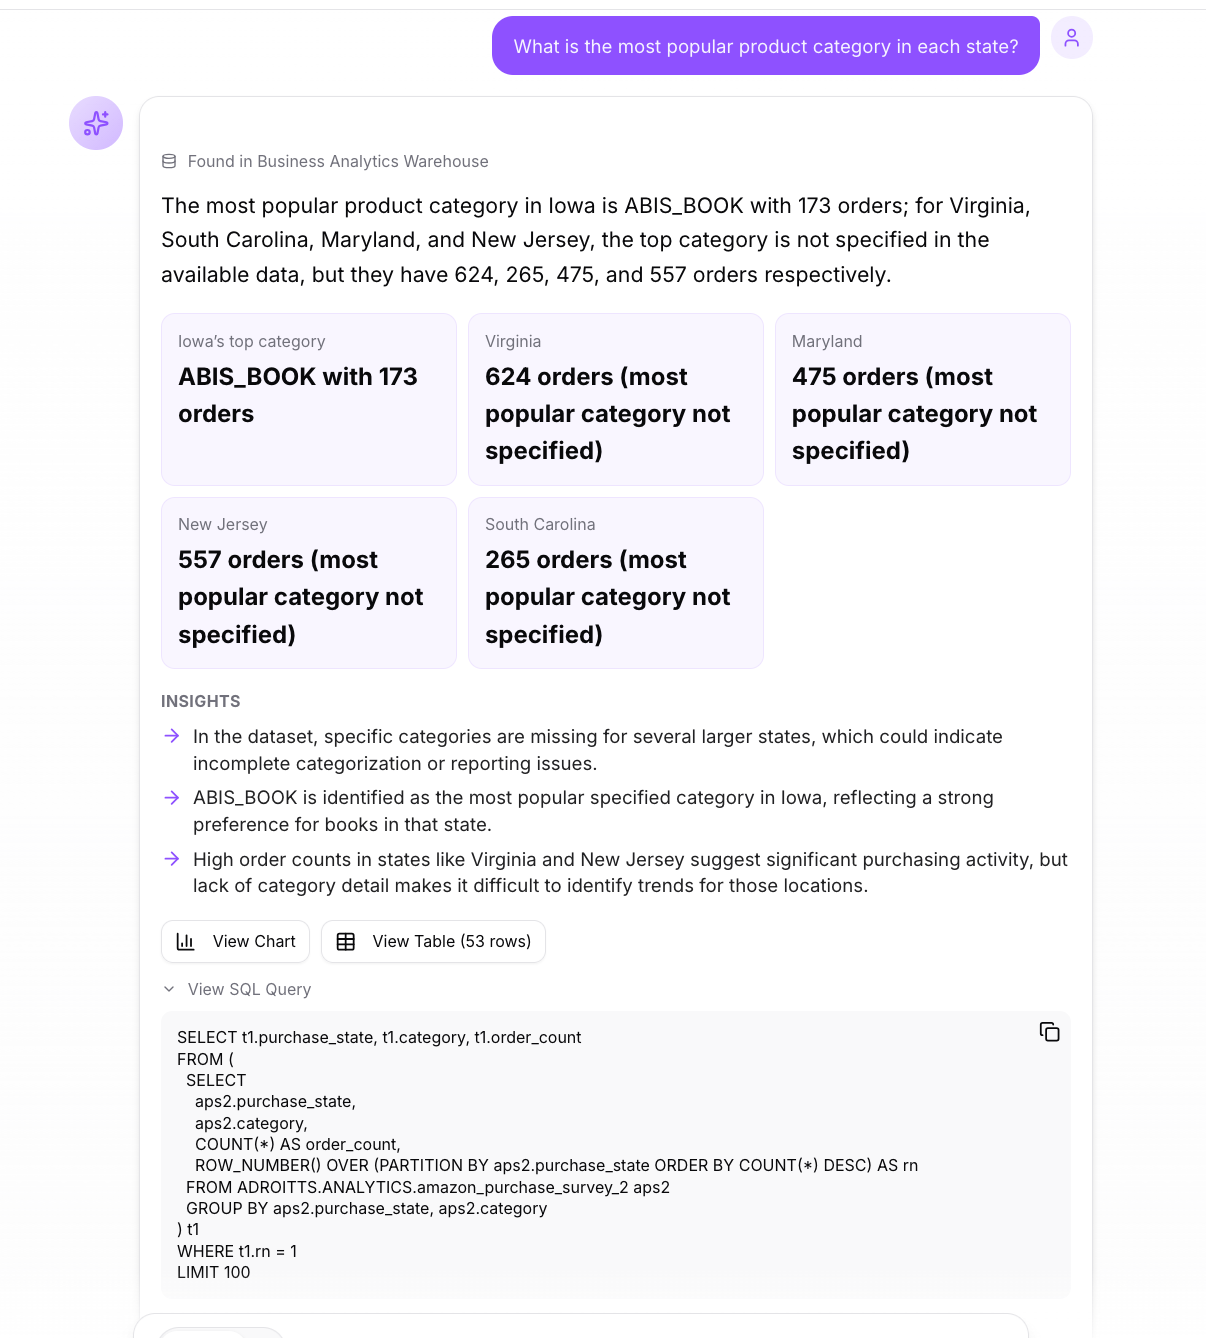
Click View SQL Query below any response to see the exact SQL that Reveal generated and executed. This is useful if you want to verify how your question was interpreted, check which tables were used, or copy the query to run it in another tool.
The example below shows a follow-up question — "What is the most popular product category in each state?" — with the generated SQL expanded below the answer.
Exporting results
Each response includes an export menu with the following options:
| Option | What it produces |
|---|---|
| Export to CSV | Downloads the result as a .csv file |
| Export to Excel | Downloads the result as an .xls file |
| Copy as Table | Copies the result as a pipe-delimited ASCII table |
| Export Chart as PNG | Downloads the current chart as a high-resolution image |
| Copy Answer | Copies the text response to your clipboard |
Presentation mode
Switch from Chat to Presentation using the toggle at the top of the results area. Presentation mode assembles all the charts and tables from your session into a single shareable view — a structured dashboard you can use to walk others through the analysis.
In Presentation mode you can add headers, text blocks, and link groups, apply a visual theme, and export or share the full presentation.
Use the Filters bar to slice the entire dashboard by a category or dimension without re-running any queries.
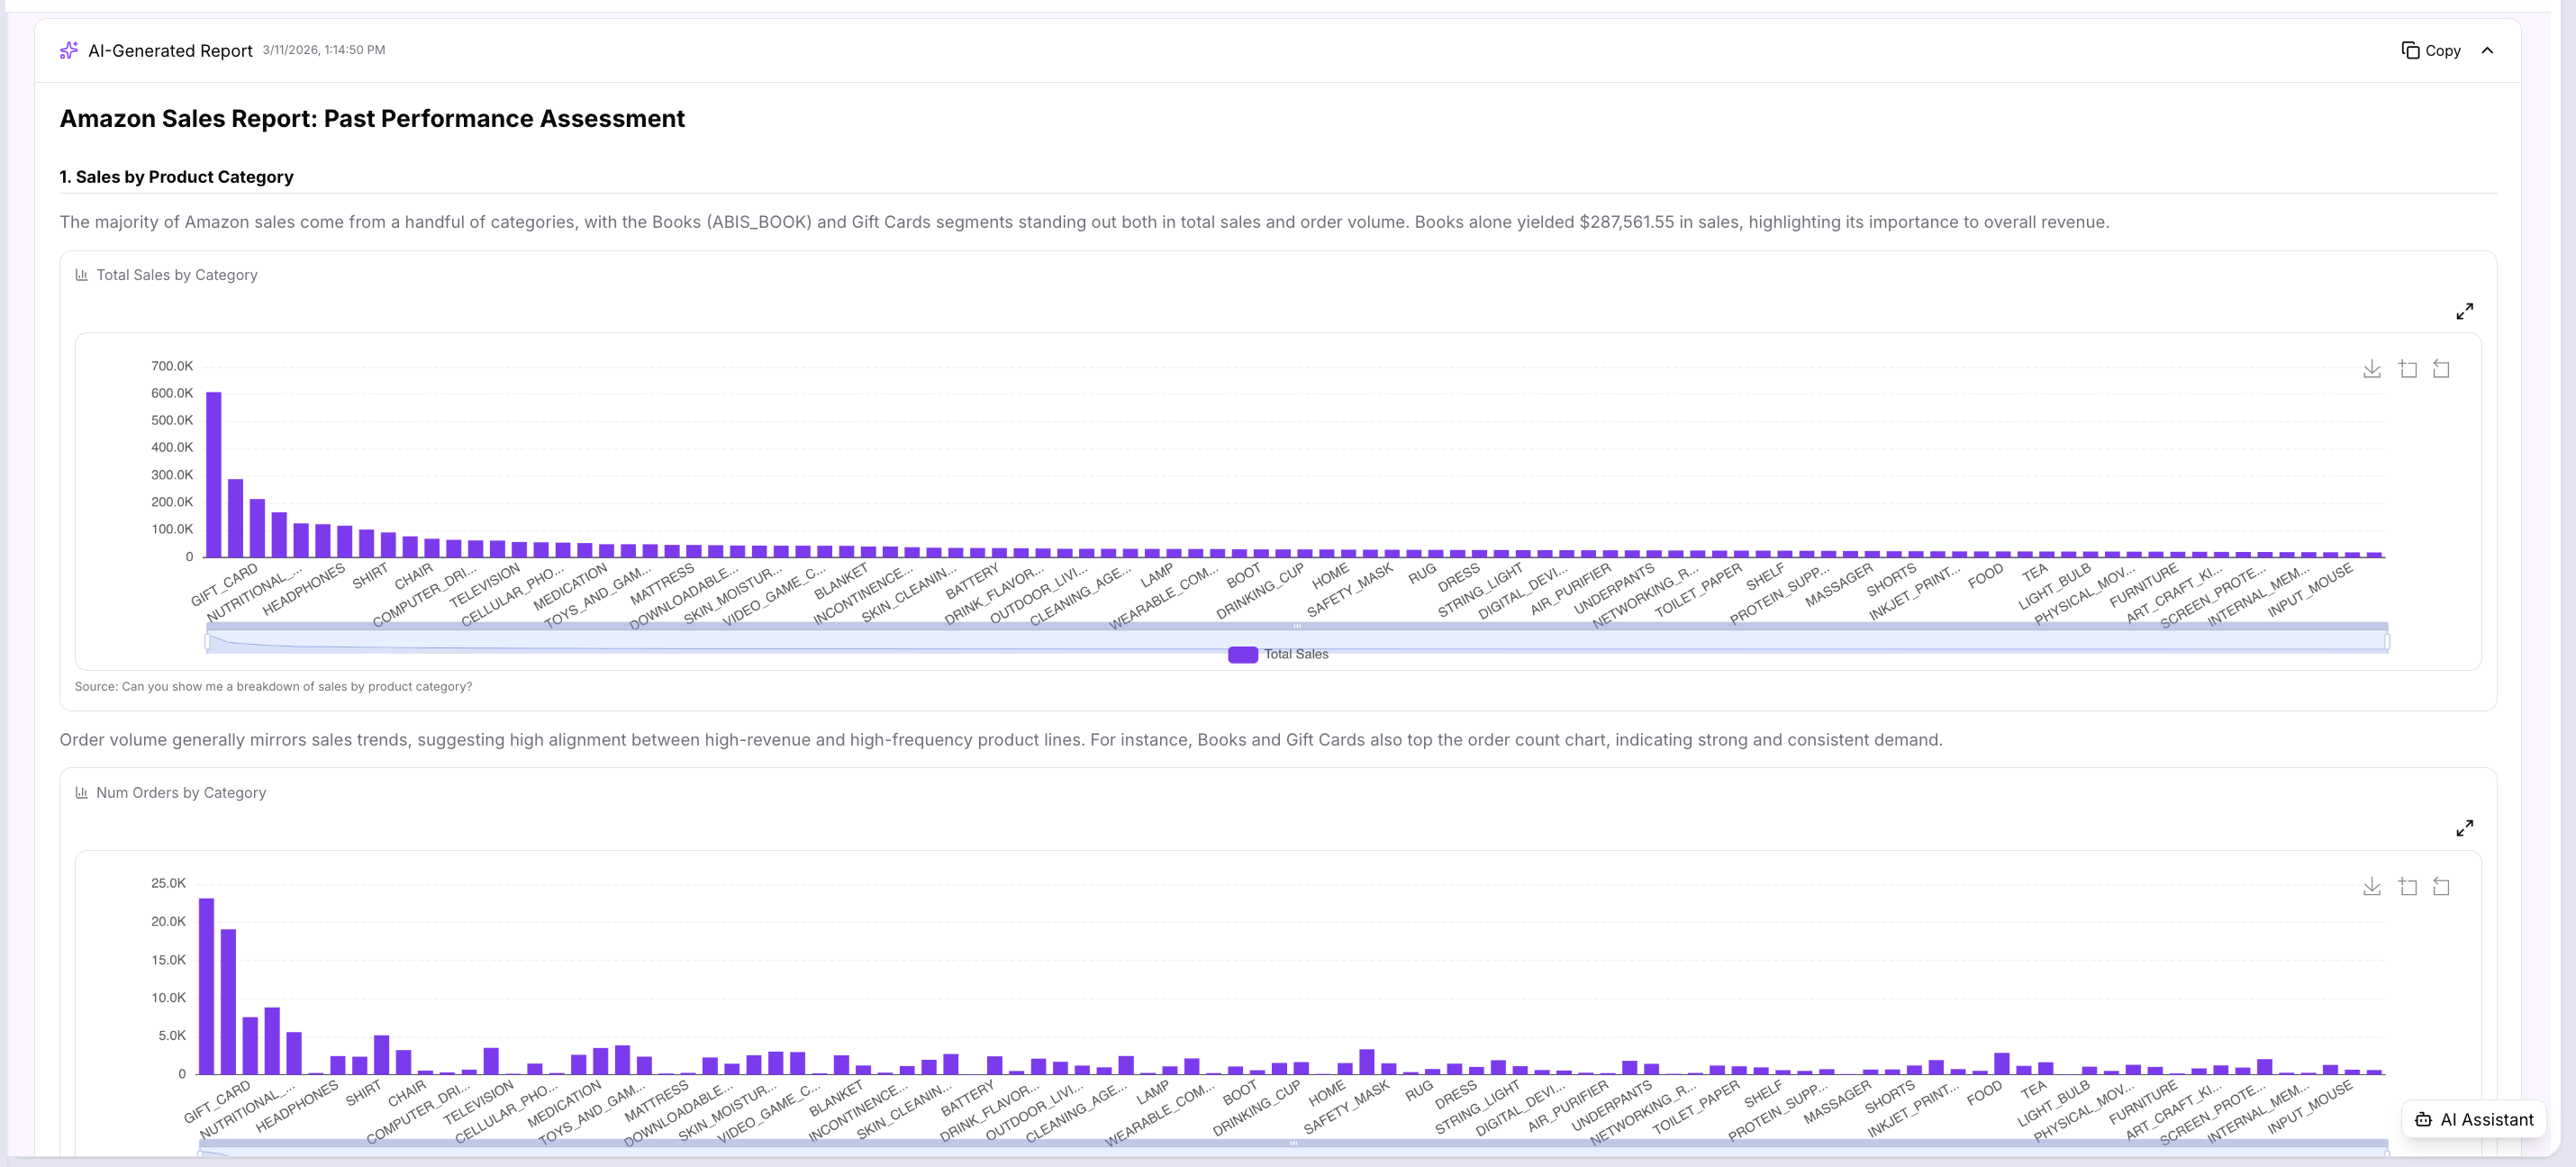
Generate Report
From Presentation mode, click Generate Report to produce a full written report from your session. Reveal writes the report automatically — it creates a section for each part of the analysis, with a plain-language narrative, inline charts pulled from your queries, and a data table for each section.
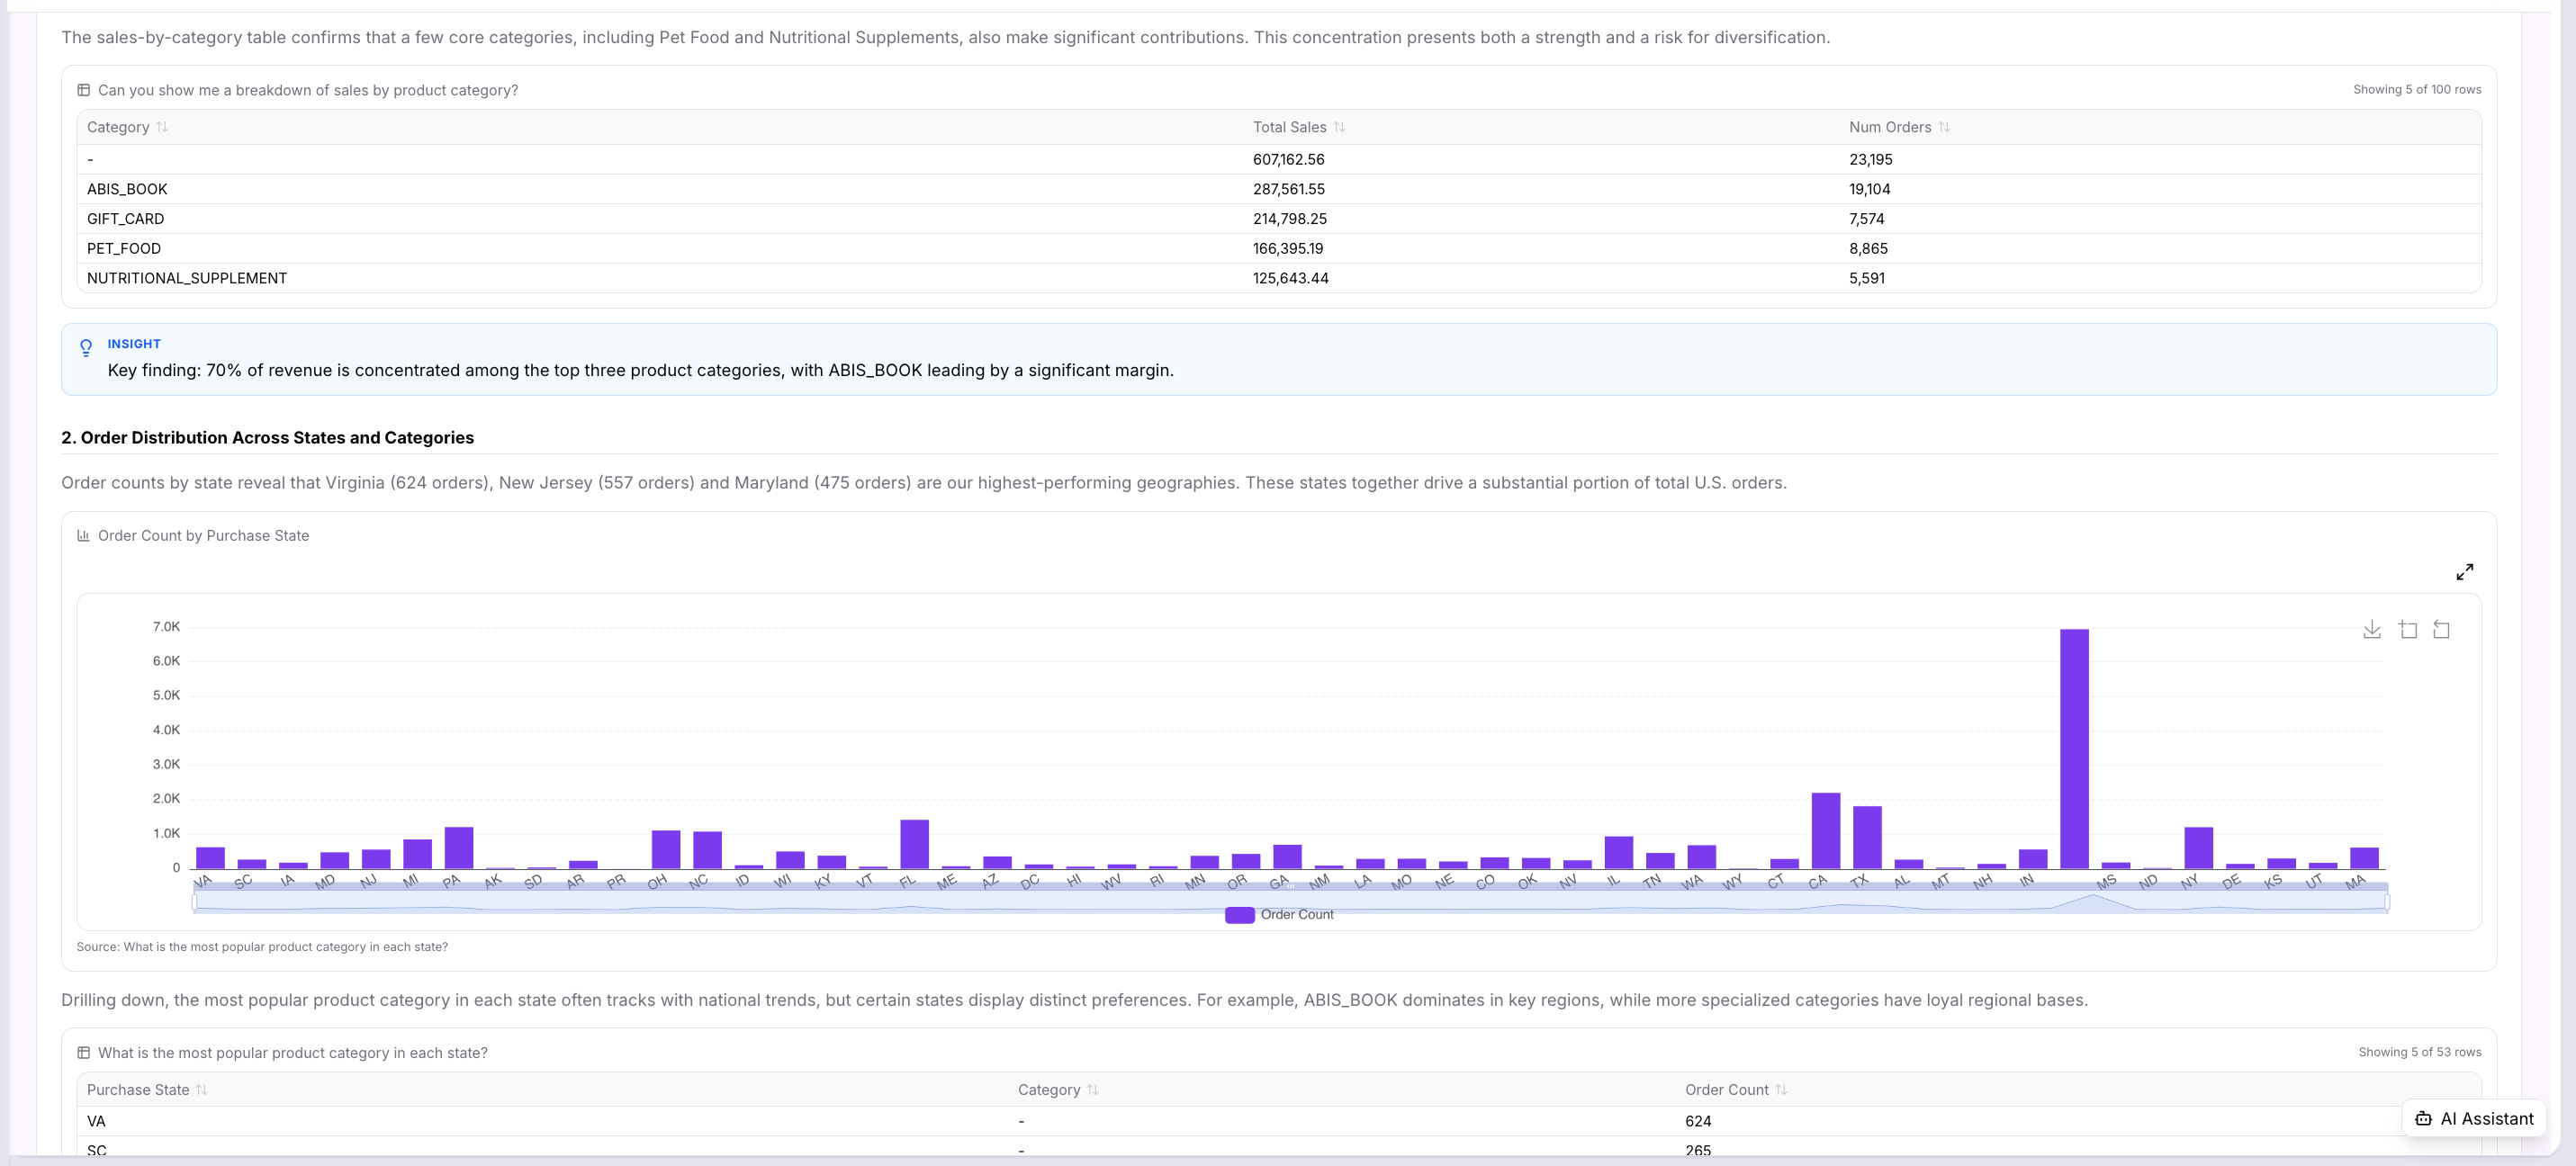
Each section includes an Insight callout — a highlighted key finding the AI identified, such as "70% of revenue is concentrated among the top three product categories."
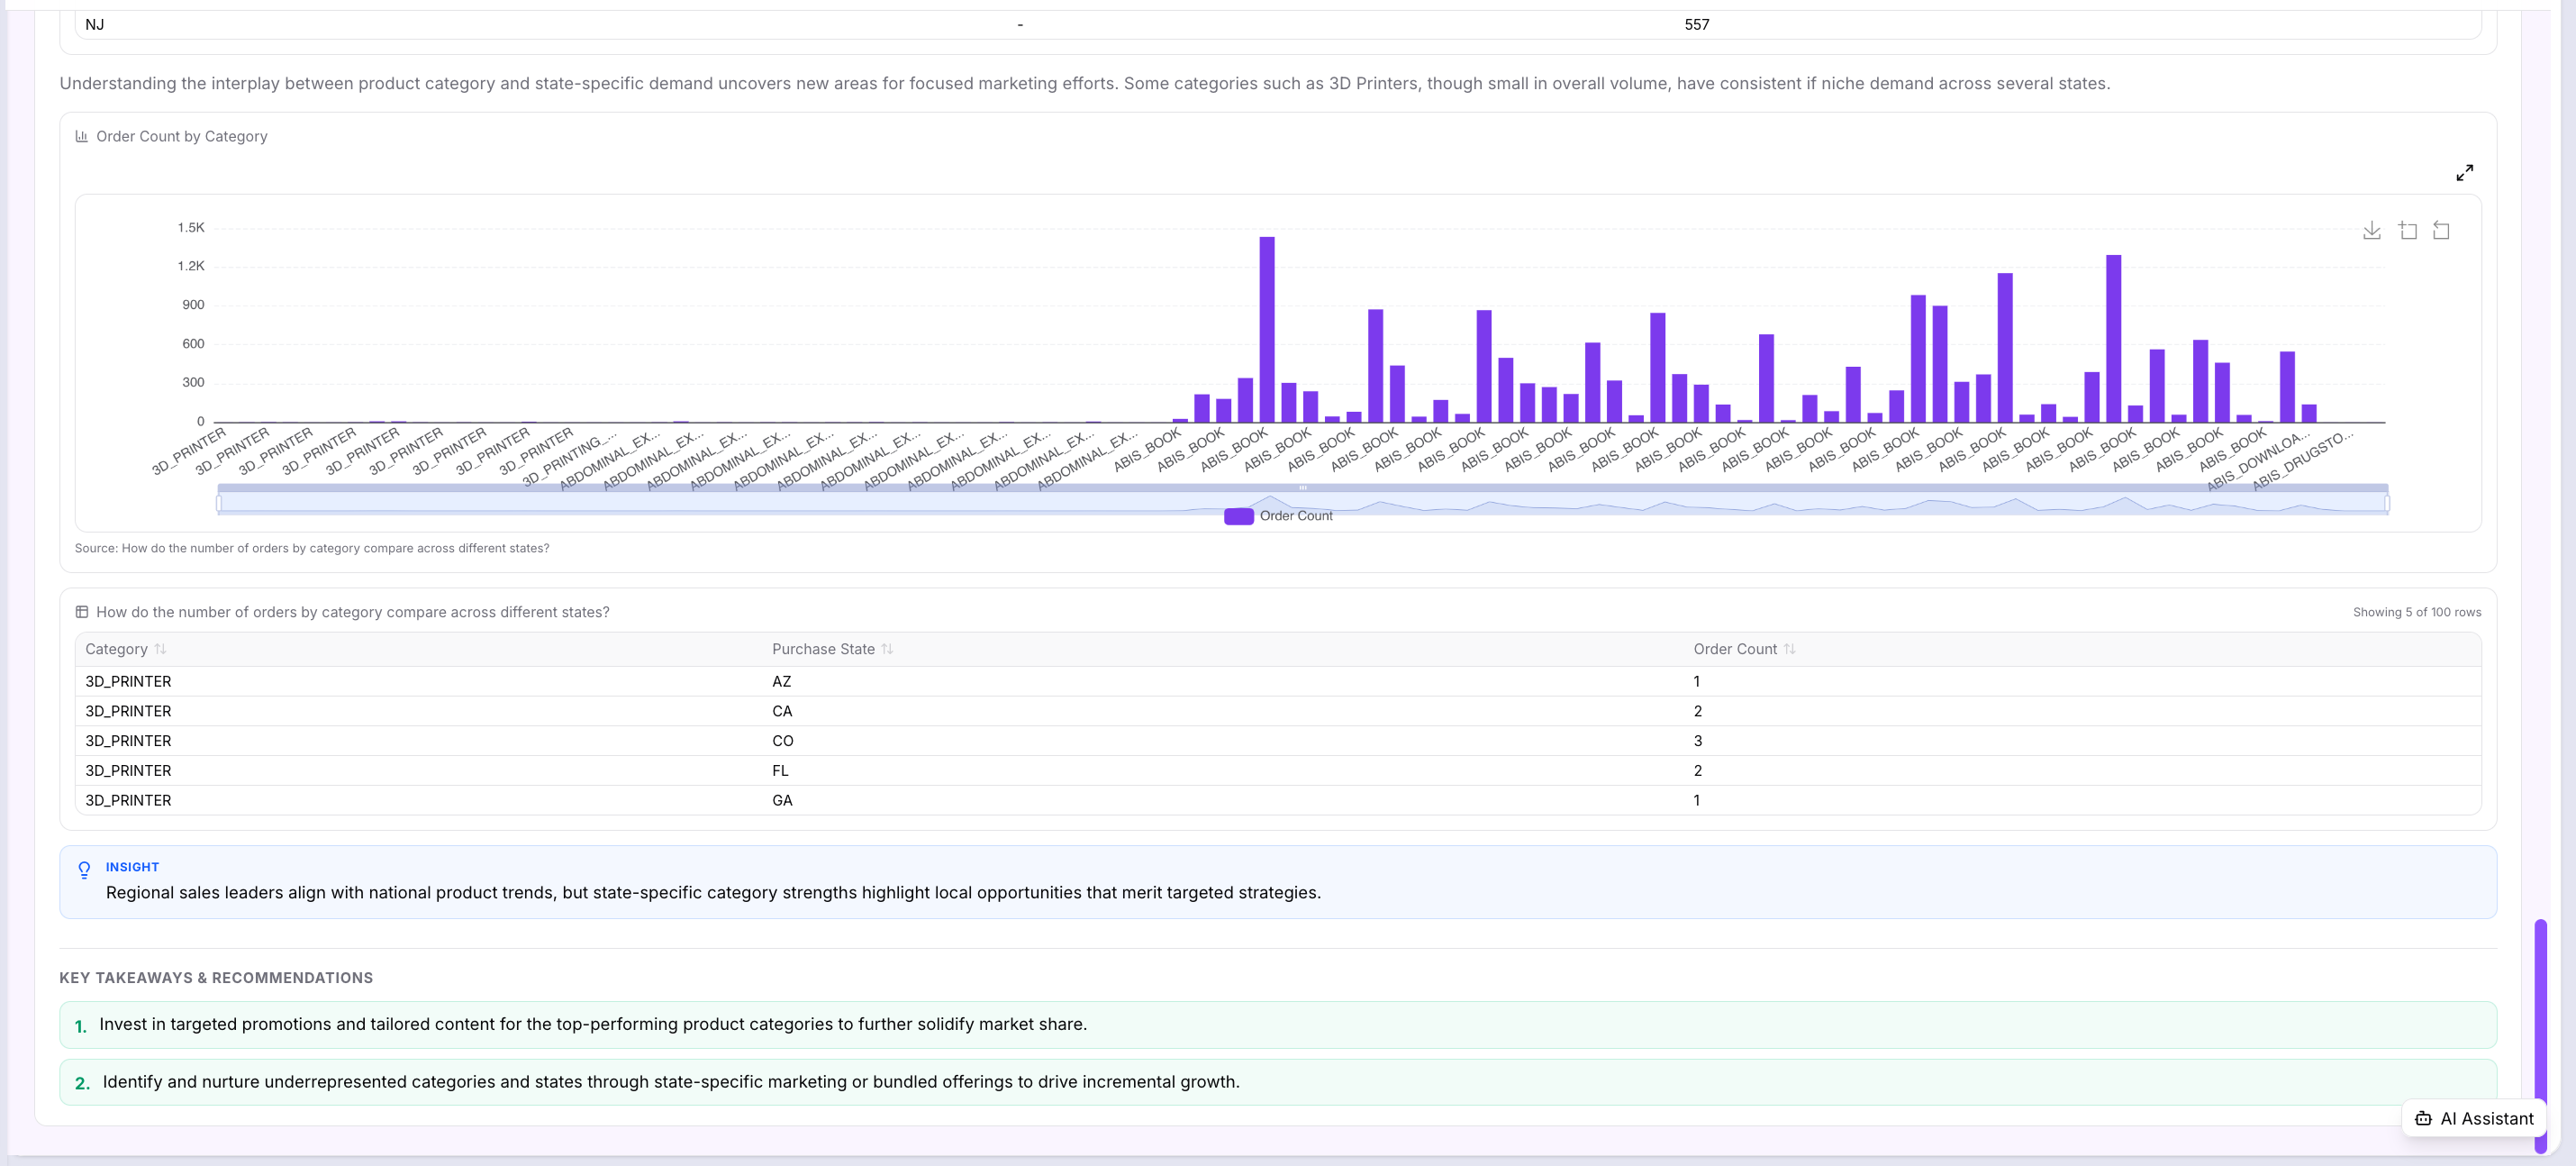
The report continues with a section for each dimension in the analysis. In this example, after the product category breakdown, the report moves to a geographic breakdown — order counts by state — with its own chart and narrative.
The report closes with Key Takeaways & Recommendations — a prioritised list of actions derived from the full analysis.
Reports can be copied or exported for sharing outside Reveal.
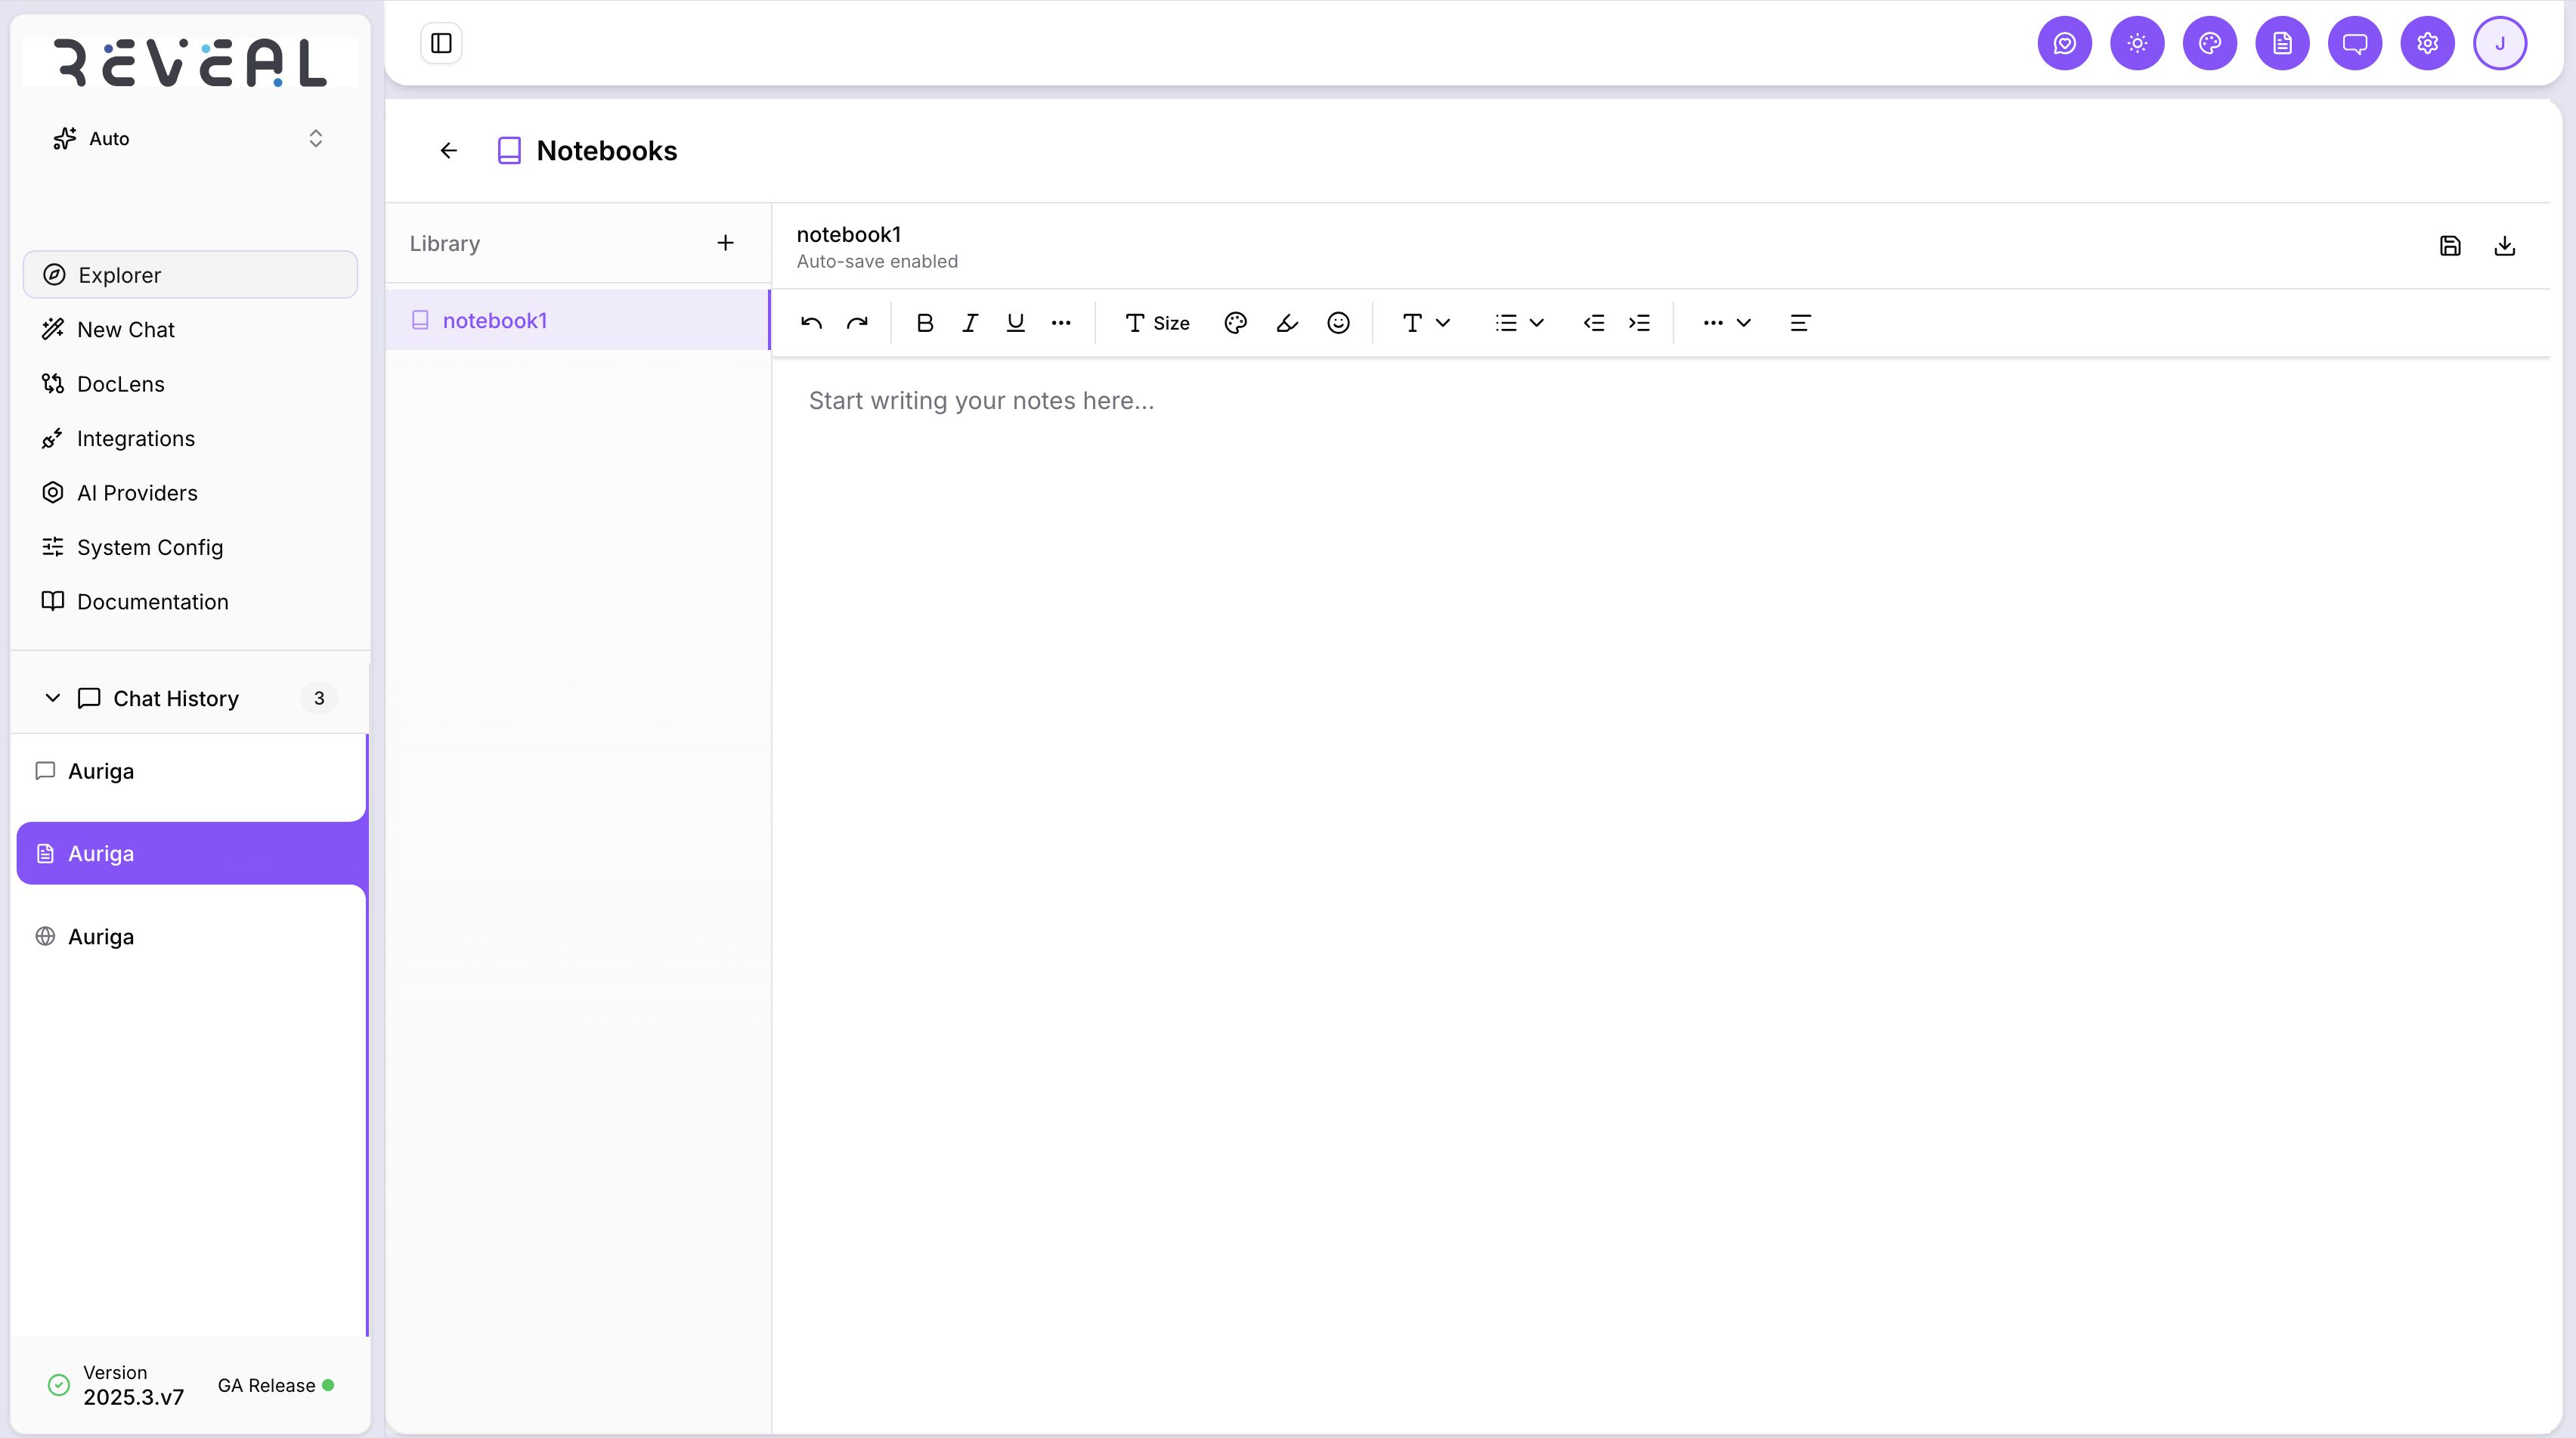
Saving to a notebook
Click Save on any response to add it to a notebook. You can save to an existing notebook or create a new one. Saved notebooks appear on the Data Explorer home screen and let you collect and revisit key findings across multiple sessions.
Conversation history
Every session is saved automatically. Click the History button at the top right of the chat view to see all your previous sessions. Each entry shows the first question as the session title, when it was last active, and how many messages it contains. Click any session to reload the full conversation.
Follow-up questions
After every response, Reveal suggests three or four follow-up questions based on the result and the tables used. Click any suggestion to send it immediately — it picks up the context of the previous answer so the follow-up is coherent without you having to repeat yourself.
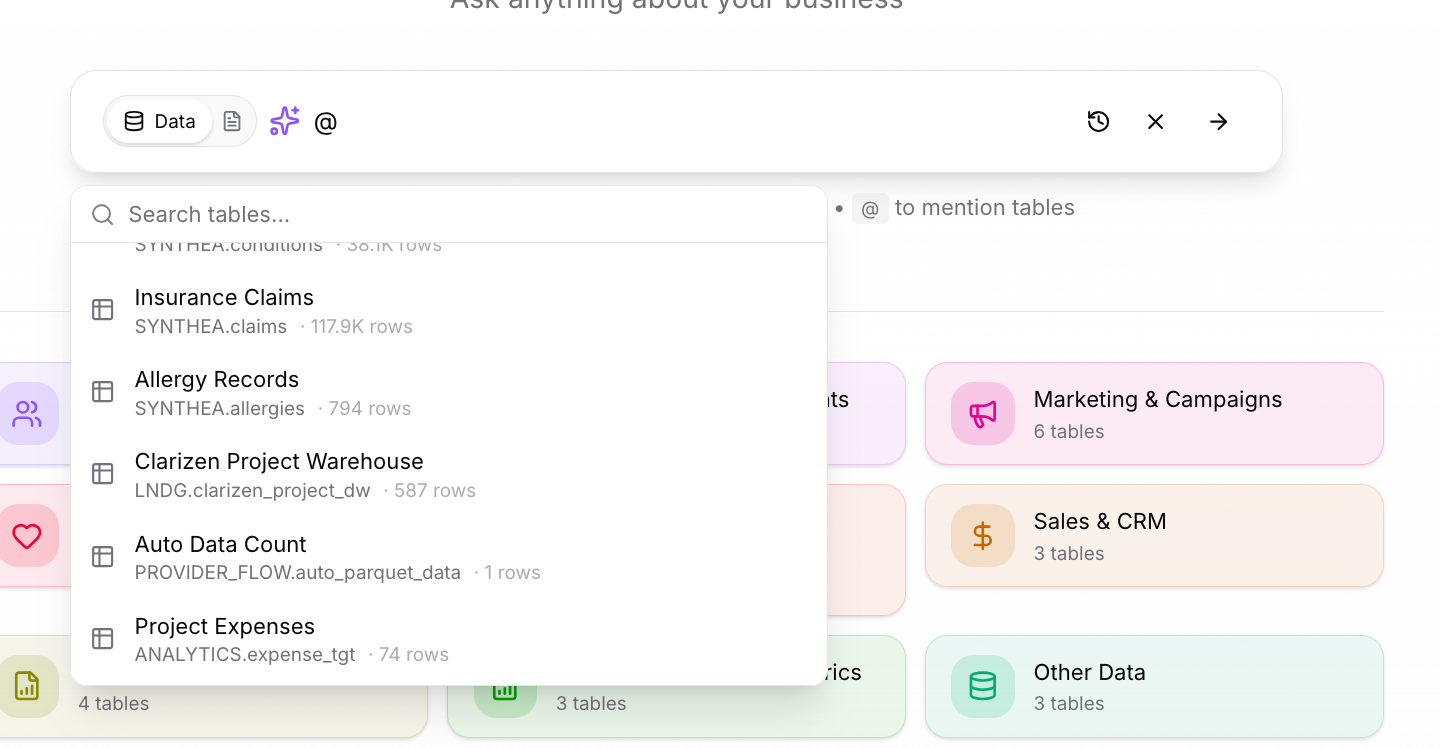
Scoping a query with @ mention
If you want to target a specific table before asking a question, type @ in the search bar to open the table picker. Reveal lists all available tables across your connected data sources, grouped by category, with row counts shown next to each name.
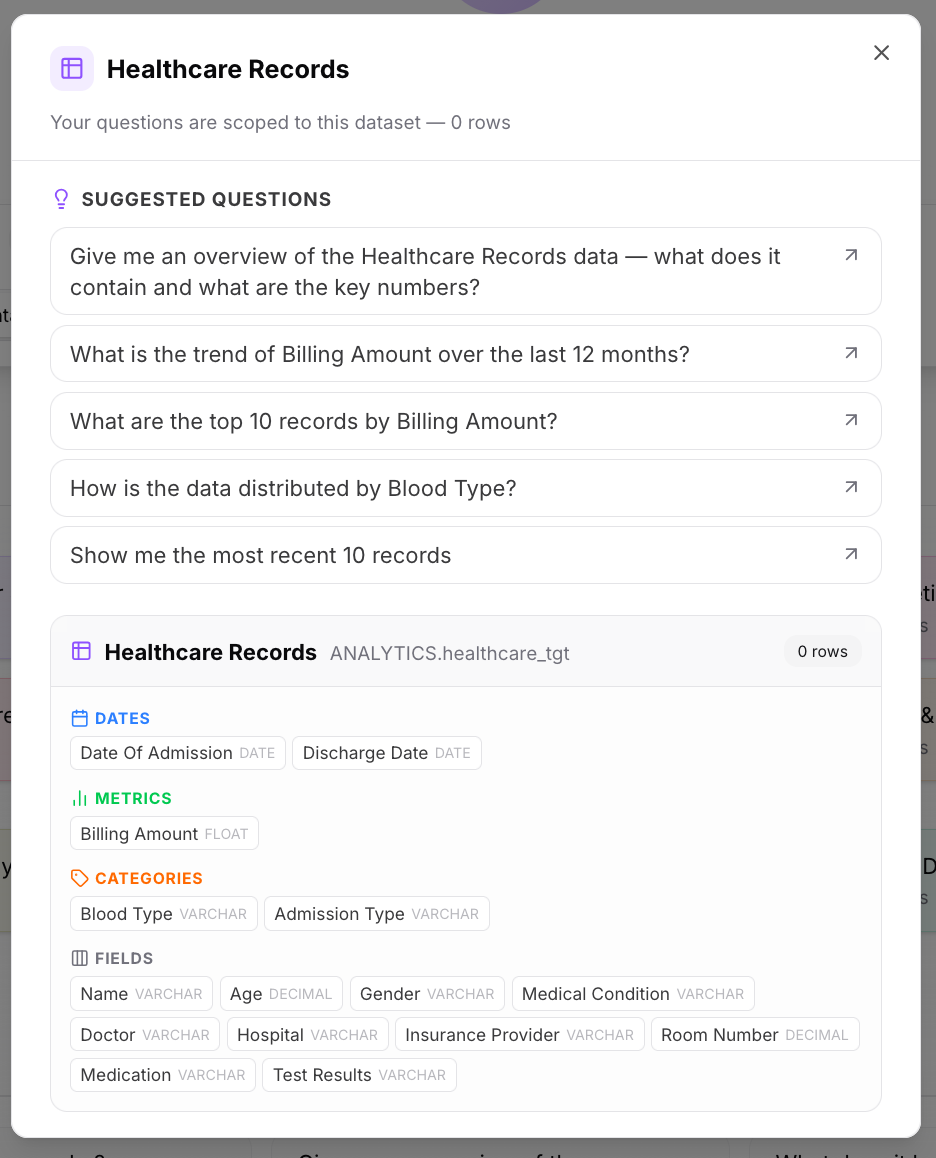
Click a table to open its metadata panel — a breakdown of what the table contains:
- Suggested Questions — AI-generated questions tailored to this table's shape
- Dates — date and timestamp columns available for time-based analysis
- Metrics — numeric columns that can be summed, averaged, or aggregated
- Categories — text columns representing segments or groups
- Fields — all remaining columns with their data types
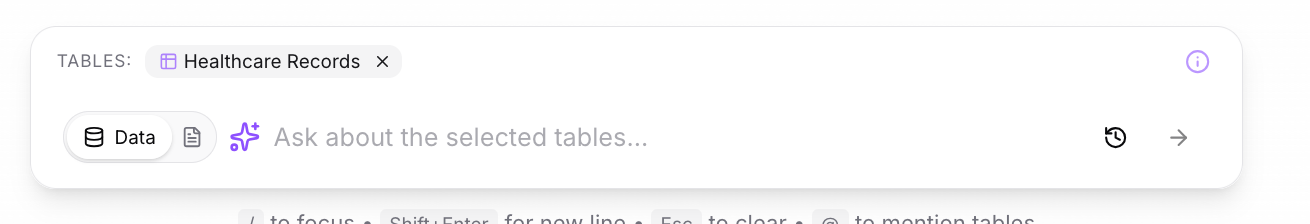
Once you select a table, it appears as a tag in the search bar. Your question will be scoped to that table only — useful when you already know which table has the data you need and want a faster, more precise answer.
Why Engine
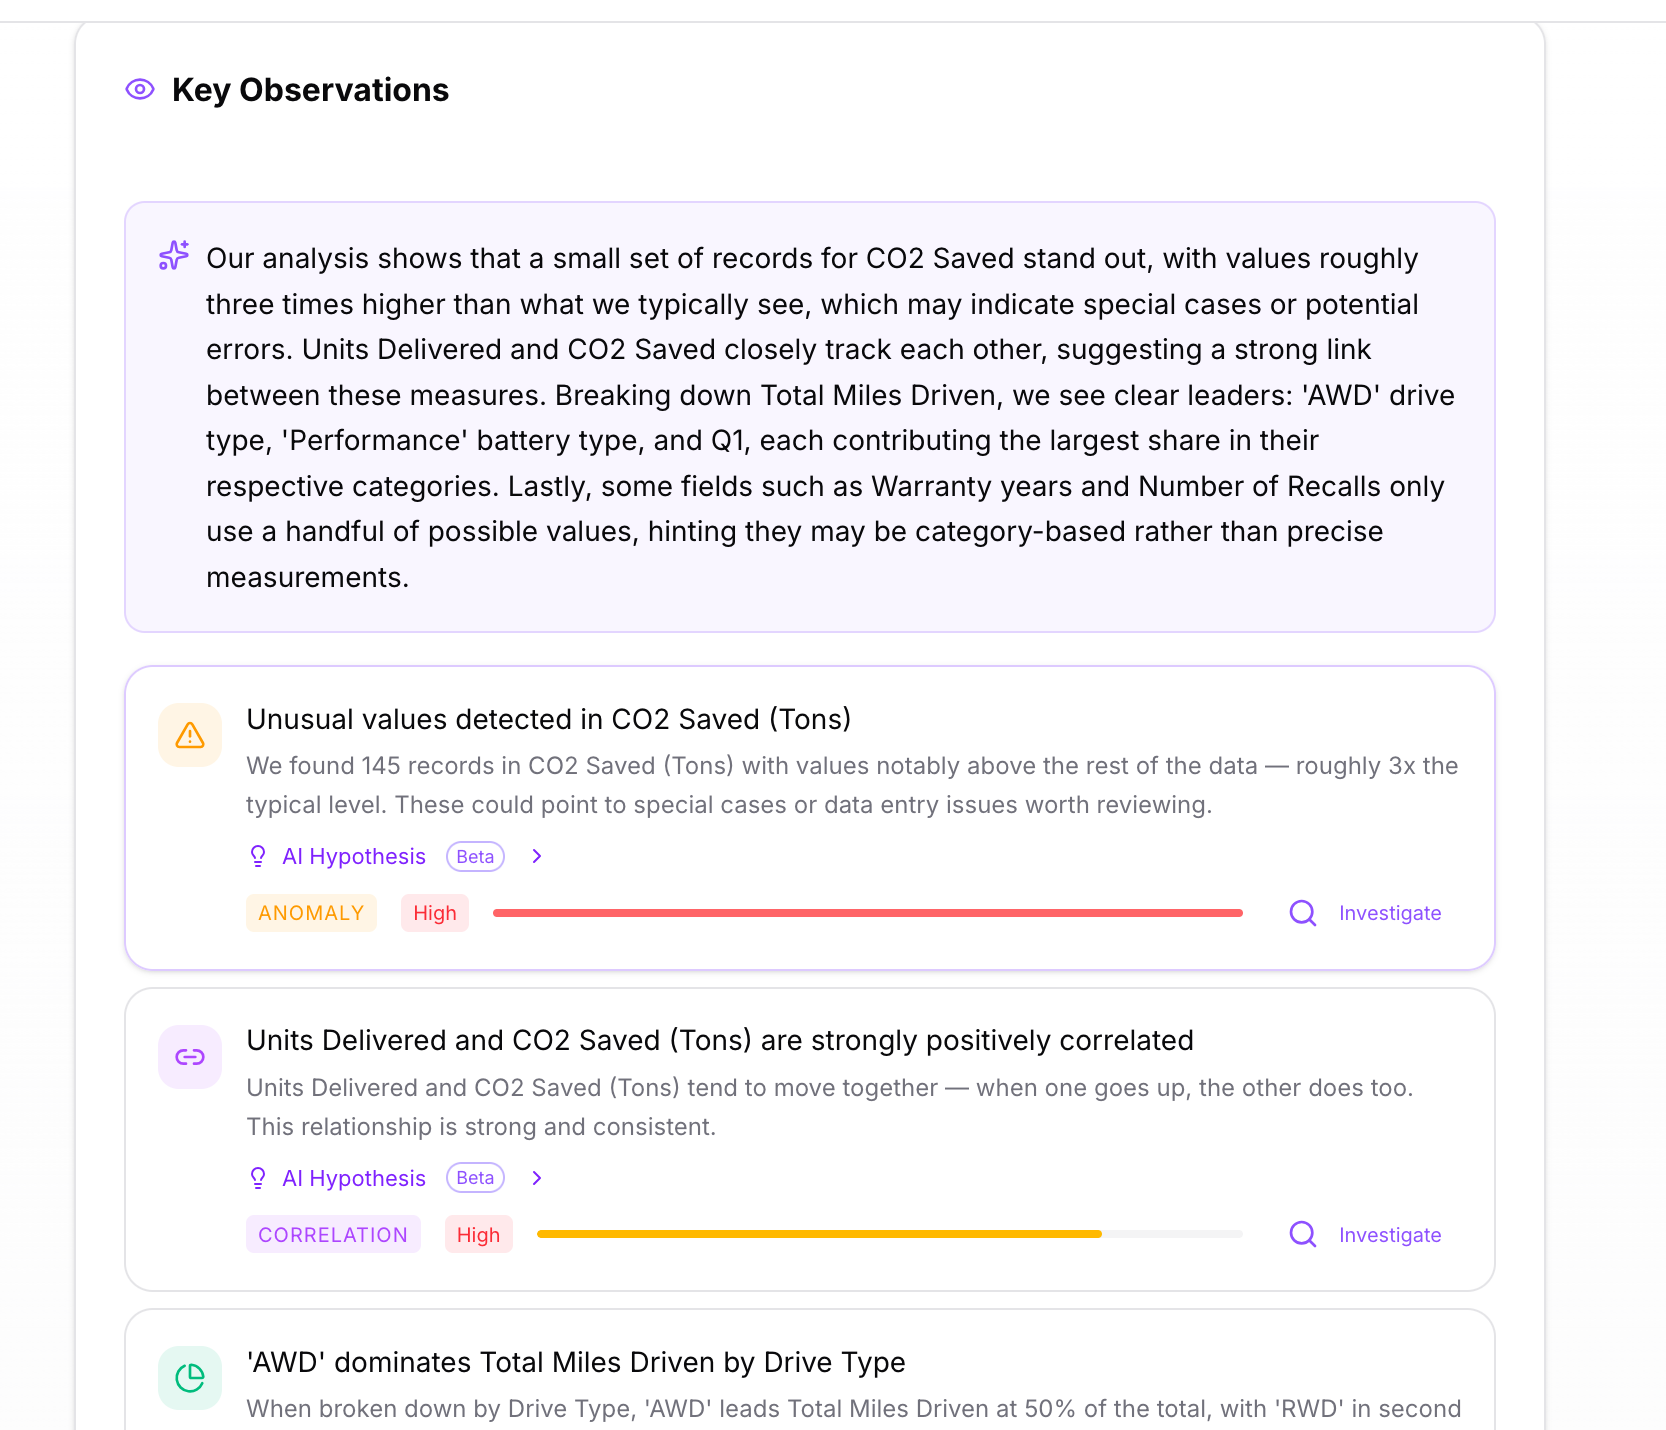
After you get an answer, Reveal runs a background analysis and surfaces a Key Observations panel alongside the result. This panel goes beyond reporting what the data shows — it surfaces patterns and explains why they exist.
Each observation card is one of three types:
| Type | What it means |
|---|---|
| Anomaly | A value that is statistically unusual — significantly higher or lower than the typical range |
| Correlation | Two measures that move together — when one goes up, the other tends to as well |
| Category Insight | A segment or group that dominates or stands out within a dimension |
Each card shows a confidence badge — High, Medium, or Low — and two action buttons:
- At Hypothesis — marks the finding as a hypothesis to track and investigate further
- Investigate — opens a side panel with a deeper explanation
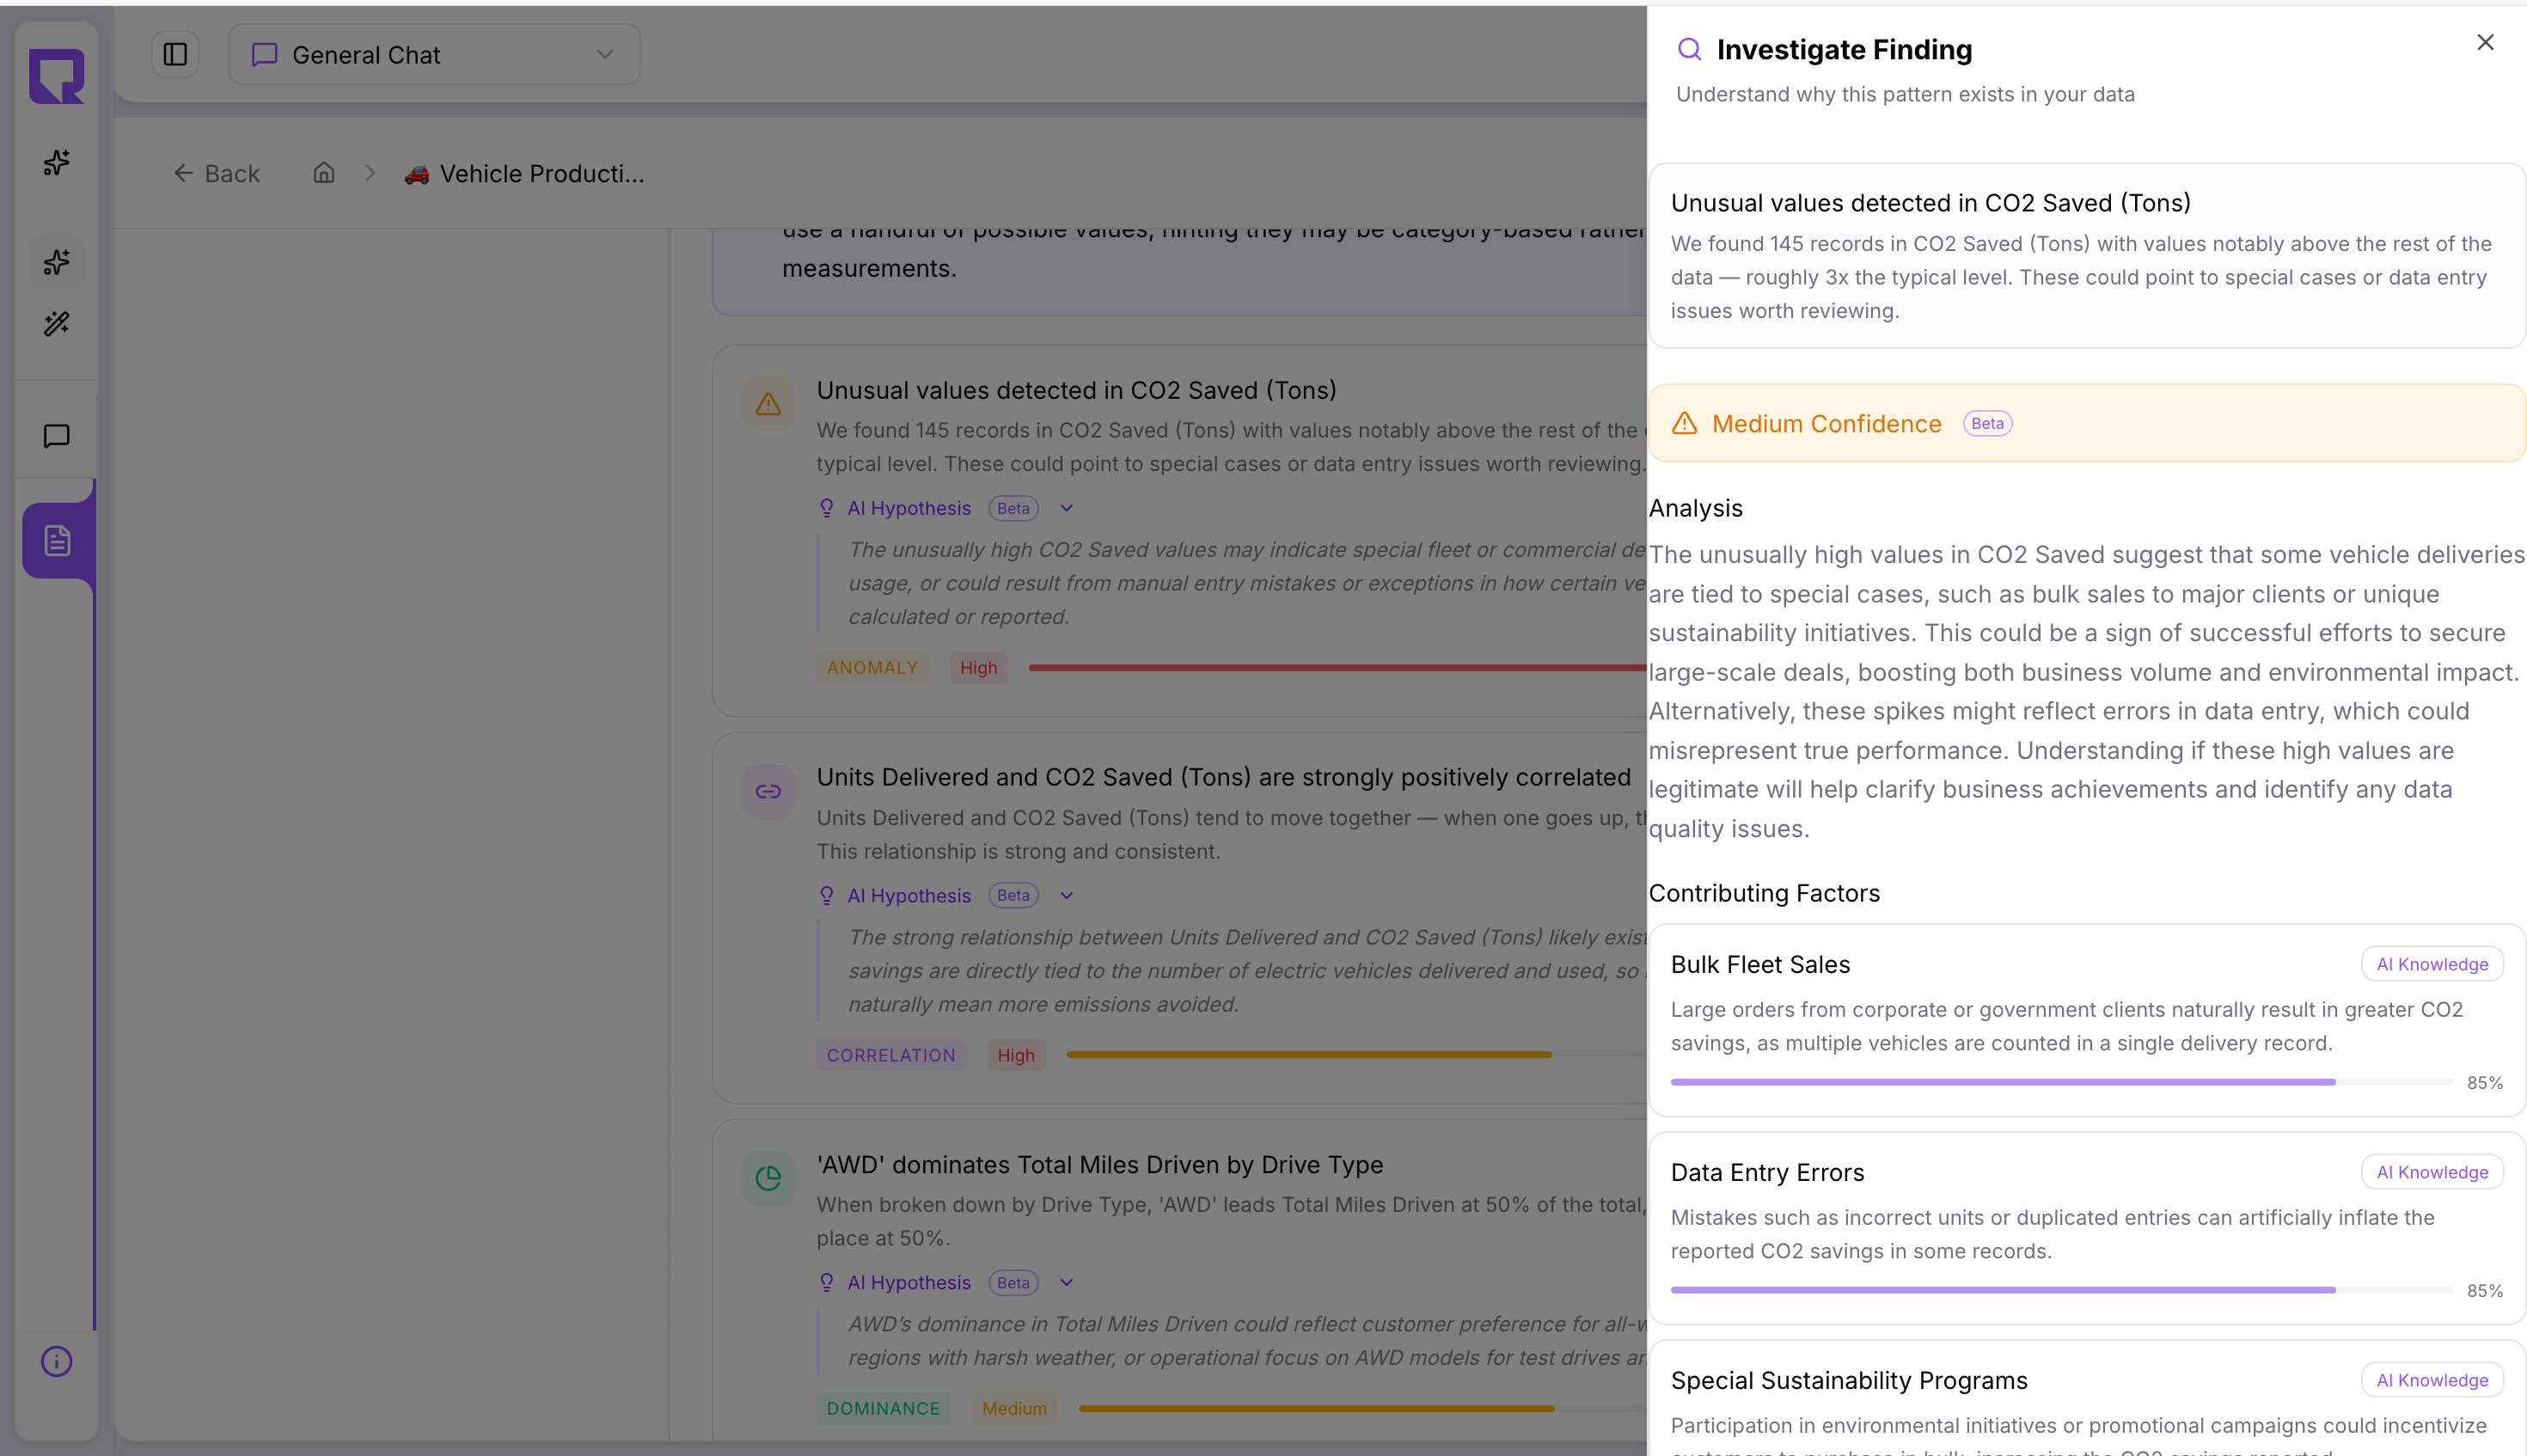
Investigating a finding
Clicking Investigate opens a panel that breaks down the finding in detail:
- Analysis — a plain-language explanation of why this pattern likely exists, grounded only in what the data shows
- Contributing Factors — a ranked list of possible causes, each with a confidence percentage bar so you can see which factors are most strongly supported
- Confidence level — an overall confidence score for the explanation
The Why Engine only reports explanations that are supported by the data. If a cause cannot be determined from the data alone, it will say so explicitly — it never invents explanations or speculates on factors not visible in the data.