Chat
Chat is the main conversational interface in Reveal. Select a connection, ask a question in plain language, and Reveal queries your data, generates a response, and returns results with charts, tables, and insights — all in one place.
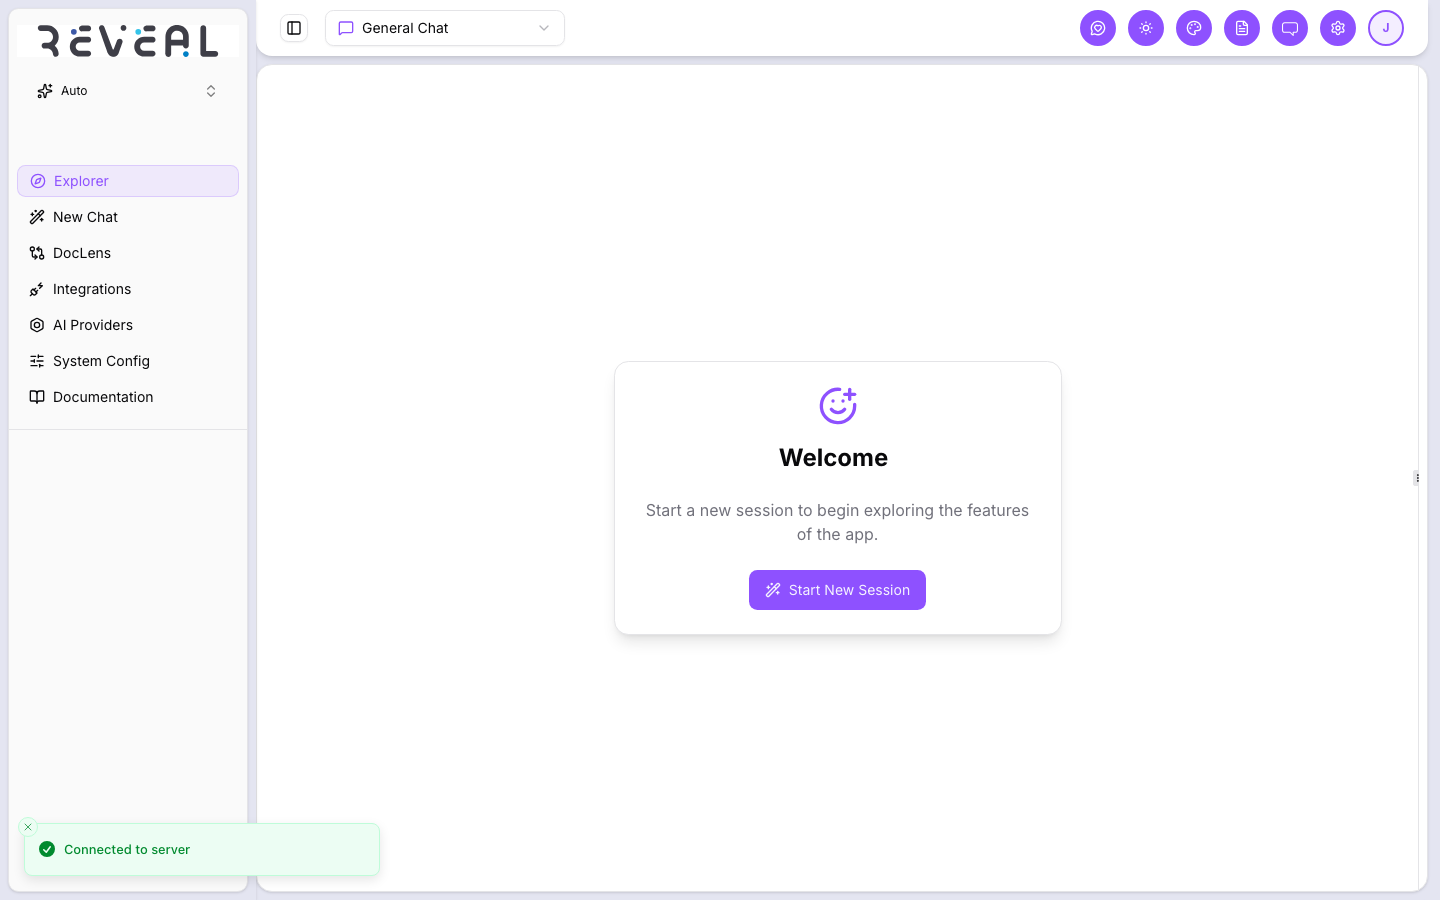
Starting a chat
Click New Chat in the left navigation to open a new session. The welcome screen appears with a Start New Session button. Select your connection from the connection selector at the top of the page, then type your question and press Enter or click Send.
The two-panel layout
Once a session is active, the interface splits into two panels:
- Left panel — Chat — where you type questions and read AI responses
- Right panel — Analyzer — shows your data schema, charts, file previews, and other views depending on what you select
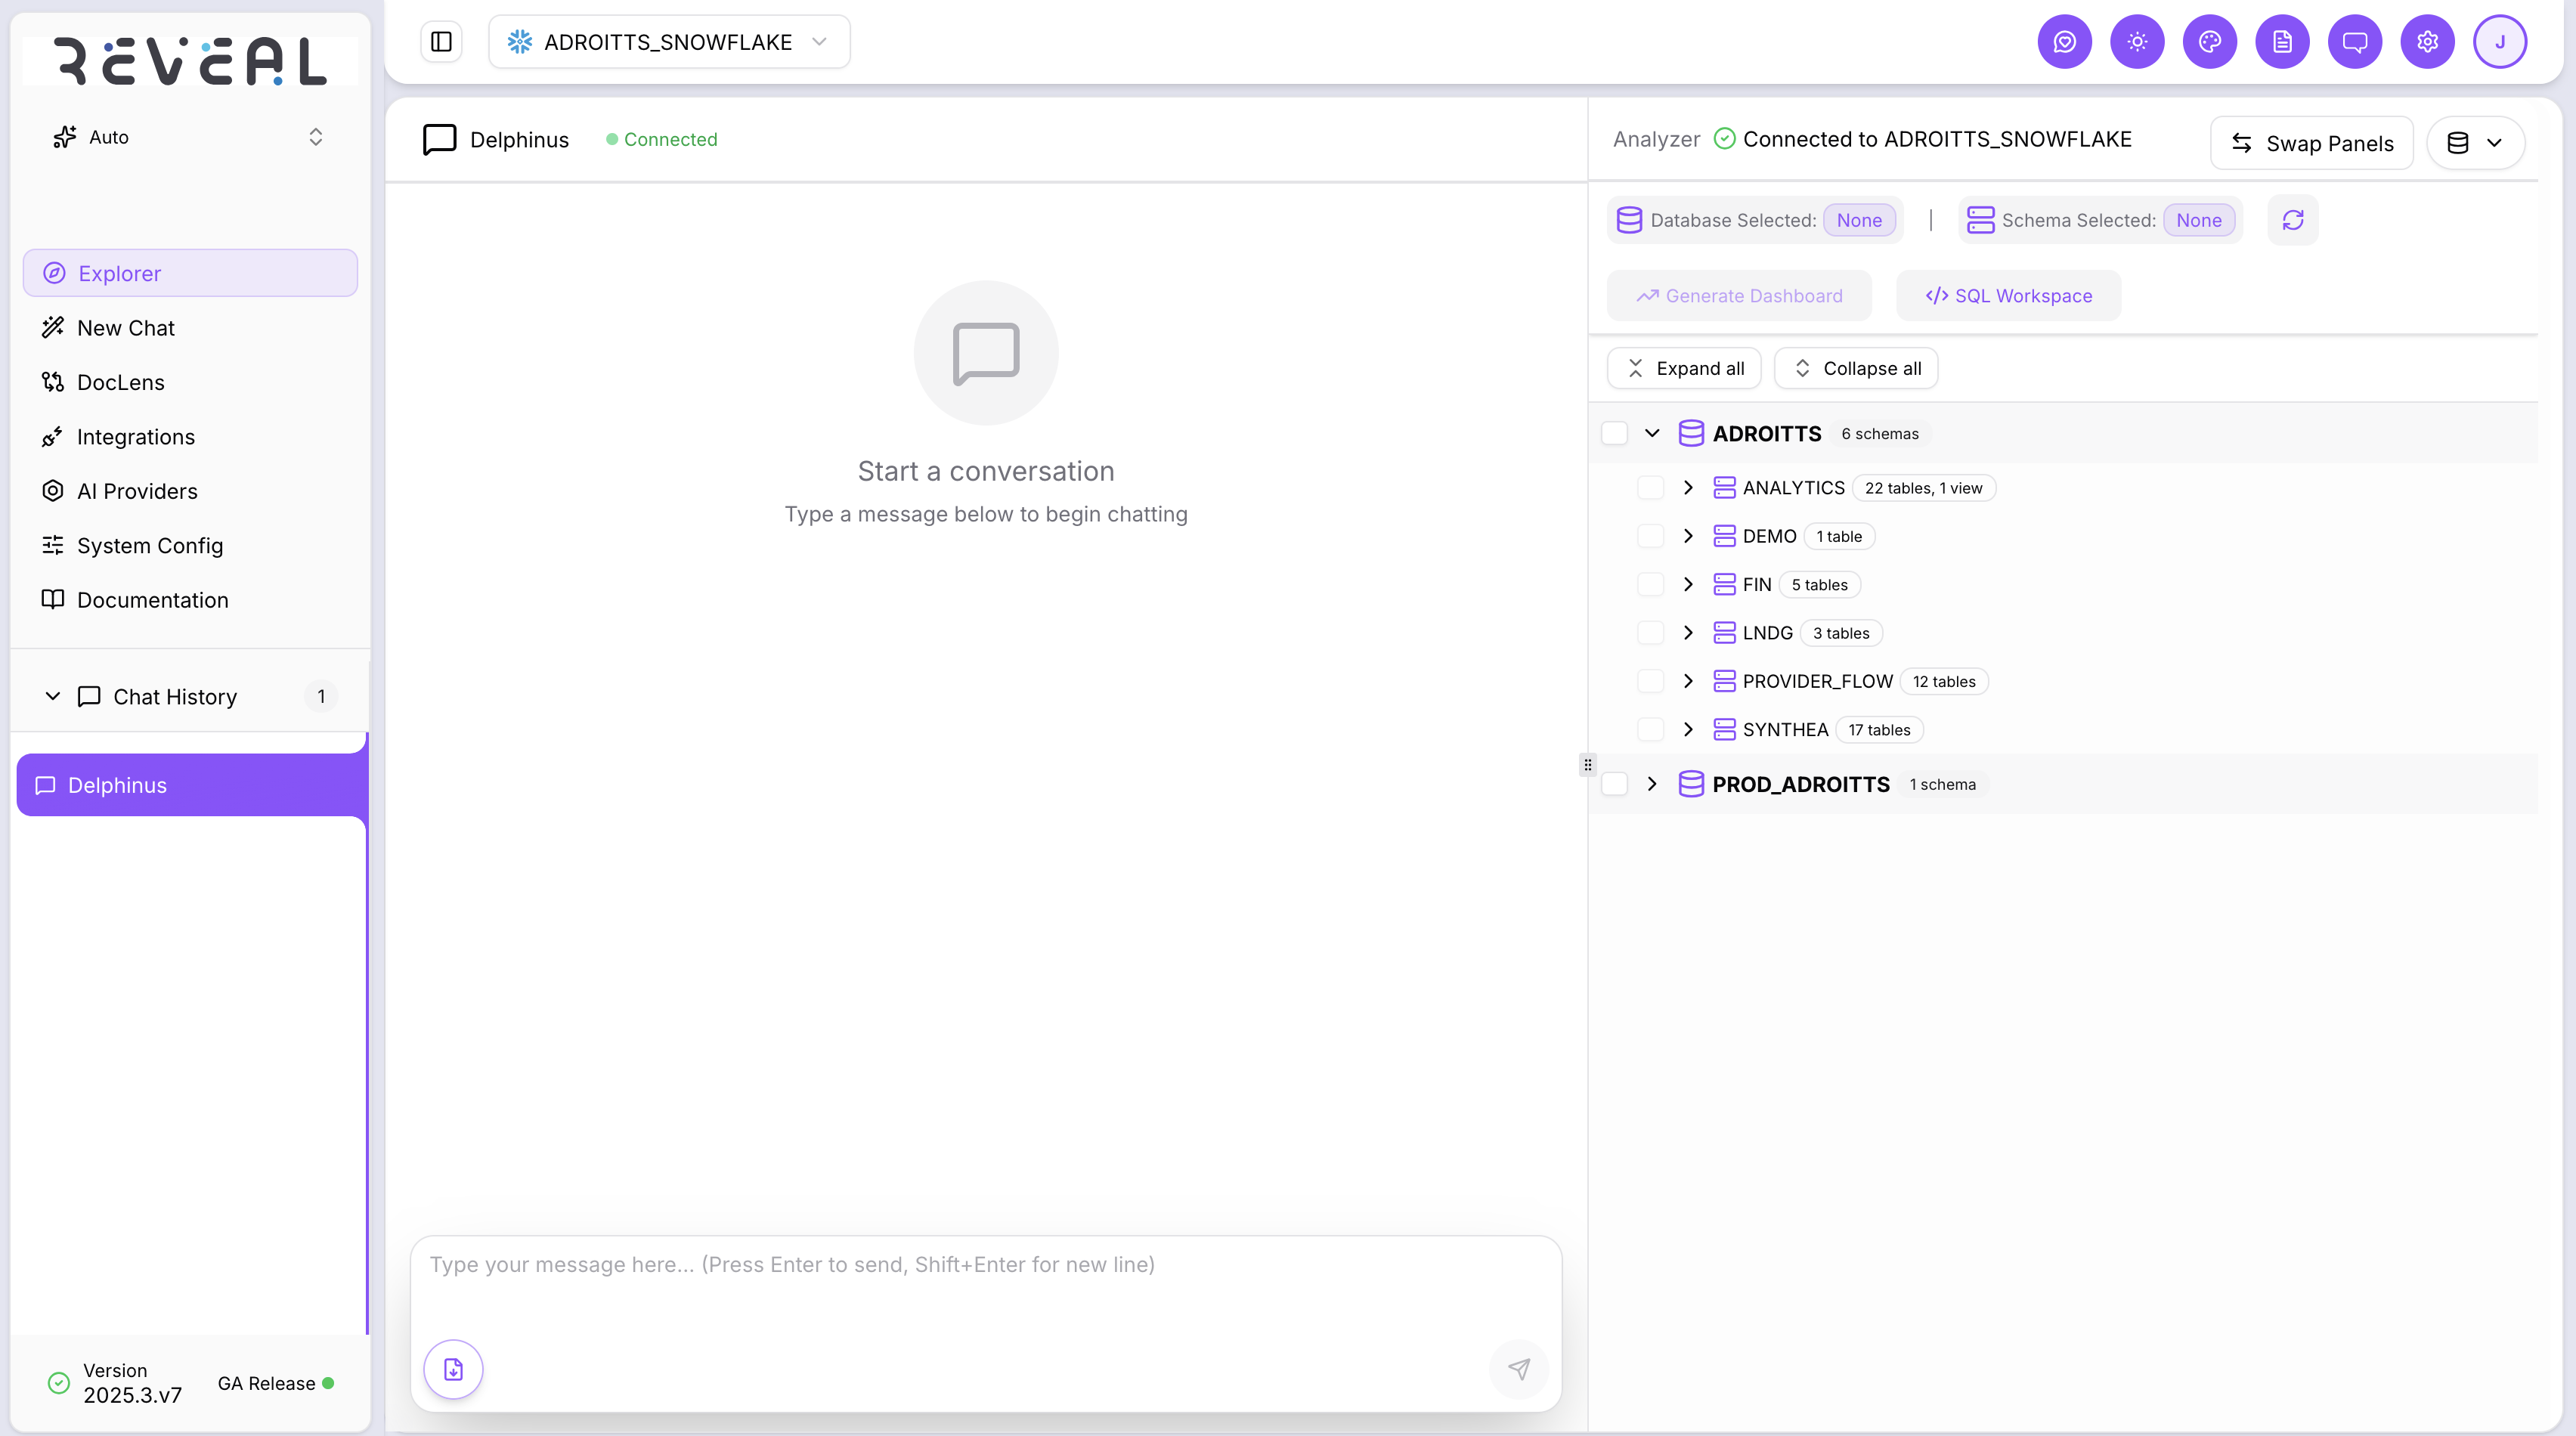
The Analyzer panel header shows which connection is active — for example, Connected to ADROITTS_SNOWFLAKE — with a green indicator when the connection is live.
Resizing: Drag the divider between the two panels to resize them to any proportion.
Swapping: Click Swap Panels to flip the chat and Analyzer to opposite sides.
The Analyzer panel — view options
The dropdown button next to Swap Panels controls what the Analyzer panel displays. Click it to open the view selector and choose from the available options.
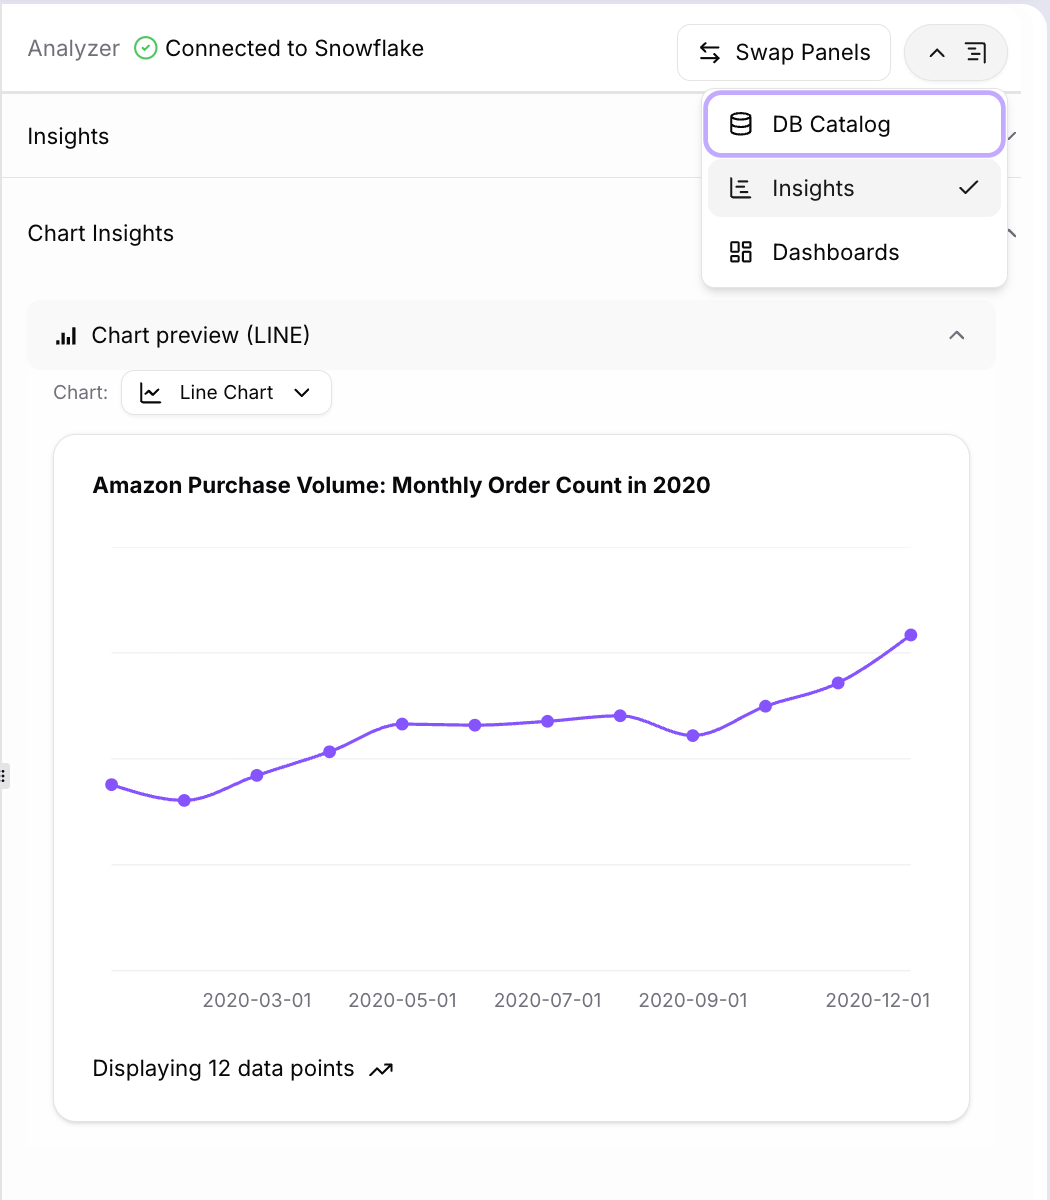
The options available depend on your configuration and active integrations:
| View | What it shows |
|---|---|
| DB Catalog | Your database schema — databases, schemas, tables, and columns. Use the Database Selected and Schema Selected dropdowns to filter. Click Generate Dashboard for a visual summary of the active schema, or SQL Workspace to open the SQL editor. |
| Insights | Chart insights from your current session — pinned charts and saved visualisations from your conversation. |
| Dashboards | Auto-generated dashboard view built from your active connection. |
| Prism Insights | Grafana dashboard embedded directly in the Analyzer panel — live metrics from your connected Grafana instance. |
| Web Browser | An in-panel web browser for referencing external pages alongside your data questions. |
| Cloud Storage | A file browser for your connected S3 or cloud storage bucket — browse folders and files without leaving chat. |
| Github | A repository and file browser for your connected GitHub integration. |
| File Upload | Upload a file to attach to the current session. Requires an active chat session to be started first. |
| Google Docs | Browse and reference files from your connected Google Docs account. |
| Report | An executive report view generated from the current session's data. |
| Sharepoint | Browse files from your connected SharePoint integration. |
| OneDrive | Browse files from your connected OneDrive Business account. |
| File Preview | Preview a file — PDF, document, or spreadsheet — directly in the Analyzer panel. |
| Mail Preview | Preview emails from your connected Outlook account. |
| Chart View | A scatter chart visualisation of the current query result. |
| Salesforce | Browse Salesforce objects and records from your connected Salesforce integration. |
DB Catalog and Insights are always available. All other views appear only when the corresponding integration is connected and enabled.
Asking questions
Type your question in the chat input and press Enter. Reveal identifies the relevant tables, generates SQL, runs the query, and returns a structured response.
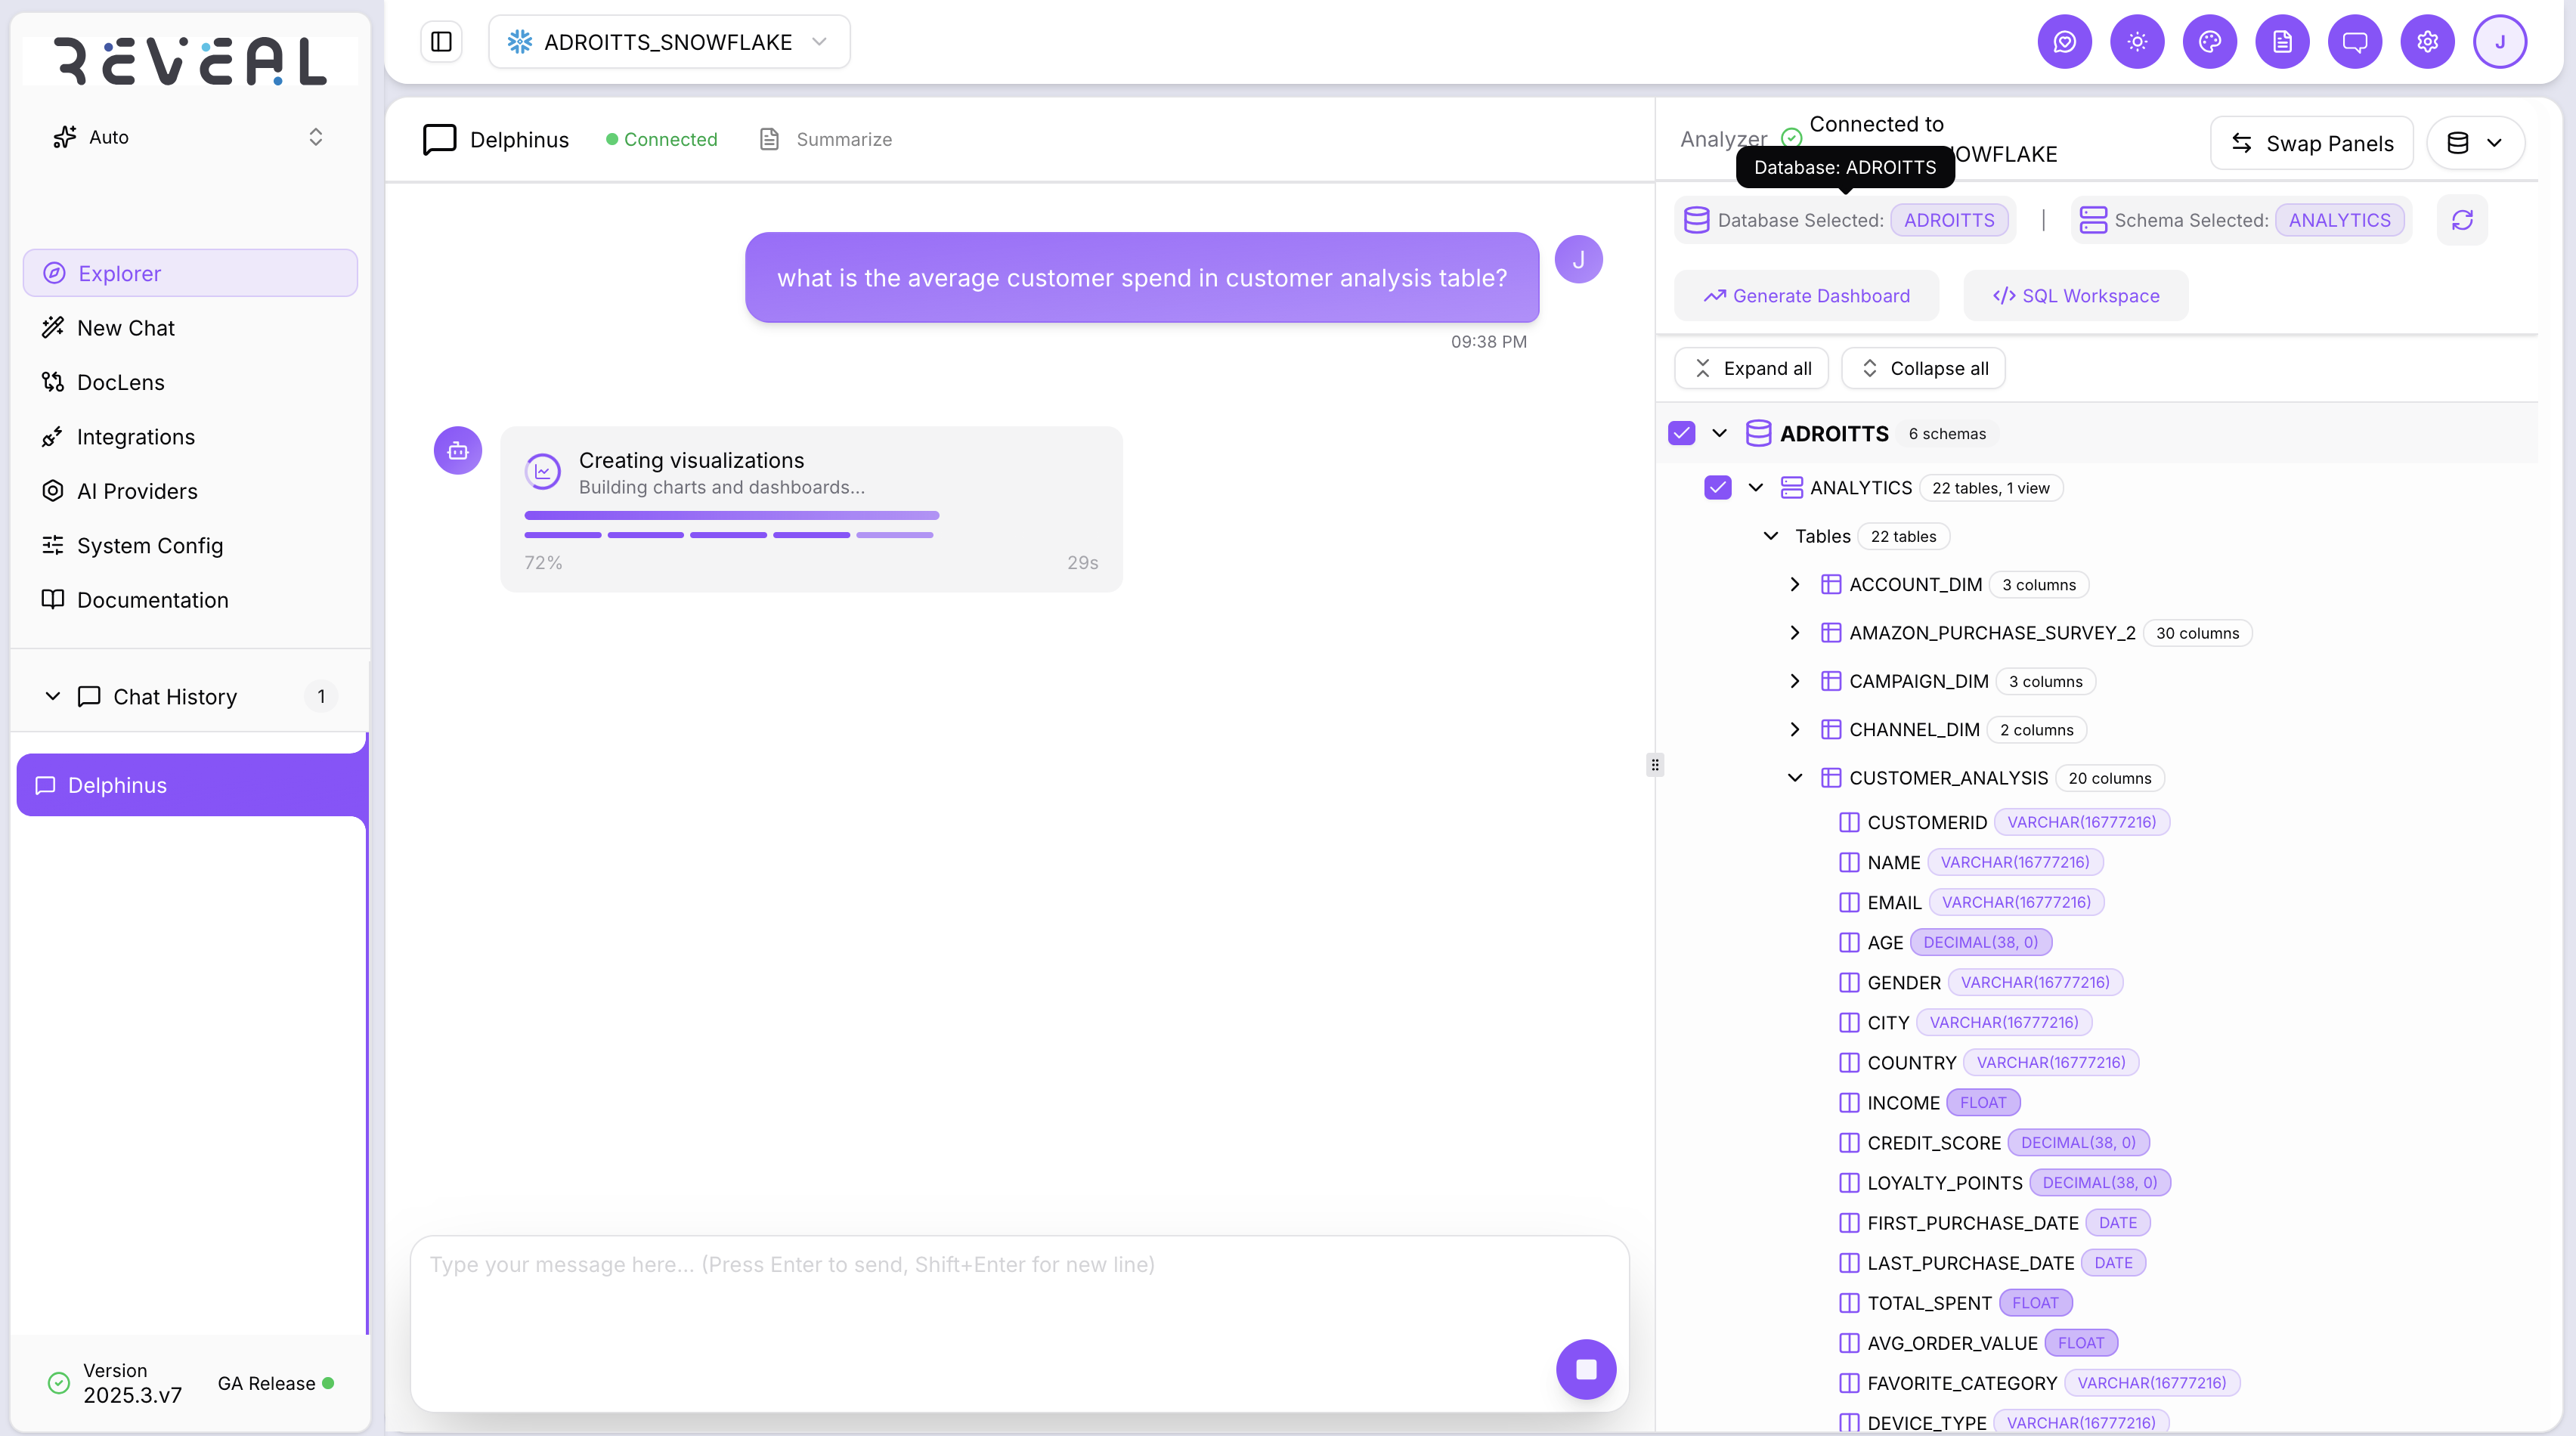
Each response includes:
- The AI-generated answer in plain language
- A chart or table where relevant
- The tables used, shown as badges
- Follow-up question suggestions at the bottom of the response
Ask follow-up questions in the same session — Reveal keeps the context of the conversation, so you can refer to previous results without repeating yourself.
Charts and dashboards
Charts appear inline in the chat when your query returns data suited to visualisation. You can switch chart types, expand to full screen, download as an image, or pin the chart to the Insights view in the Analyzer panel.
Click Generate Dashboard in the DB Catalog view to create a multi-chart visual overview of the active schema or selected tables.
File preview in Chat
When a file-based connection is active (such as S3 or OneDrive), select the File Preview view in the Analyzer panel to open a document alongside your chat. You can page through the document and ask questions about its contents while viewing the source material.
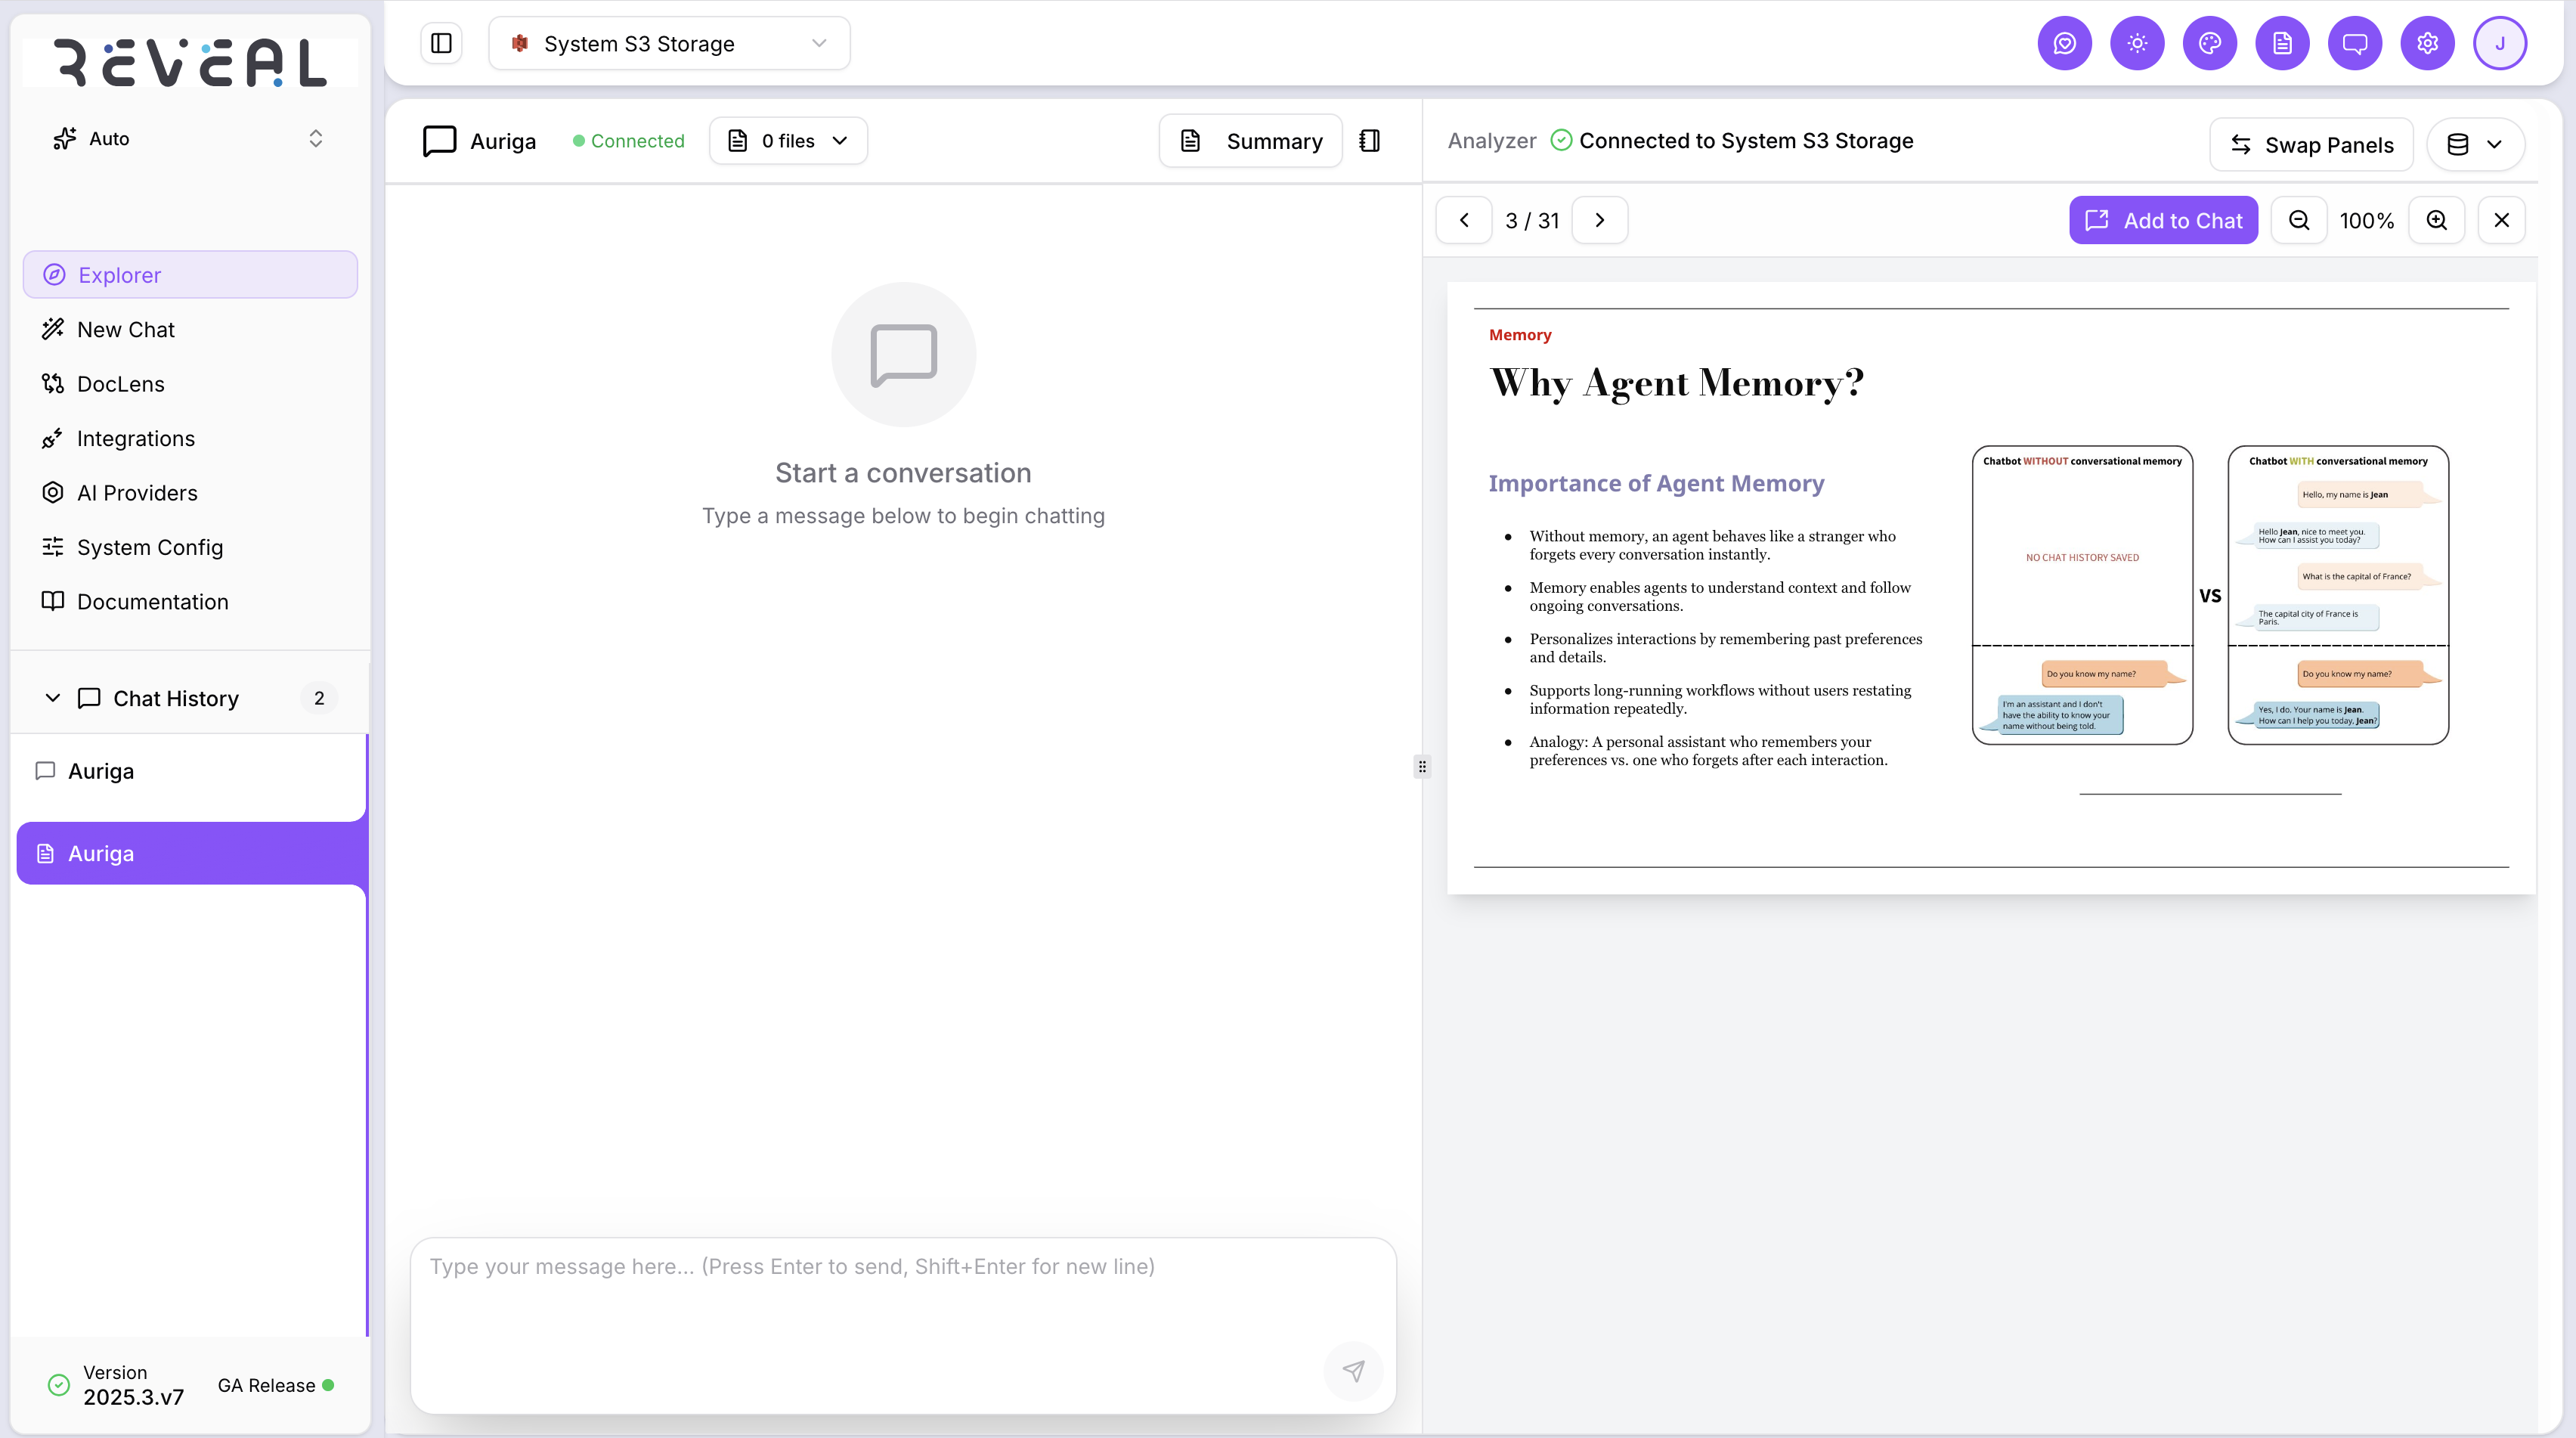
The file preview shows the page number and total page count, and includes an Add to Chat button to bring the file content into the conversation context.
Chat history
All conversations are saved automatically. The Chat History section in the left navigation lists all past sessions by name. Click any session to reload it.
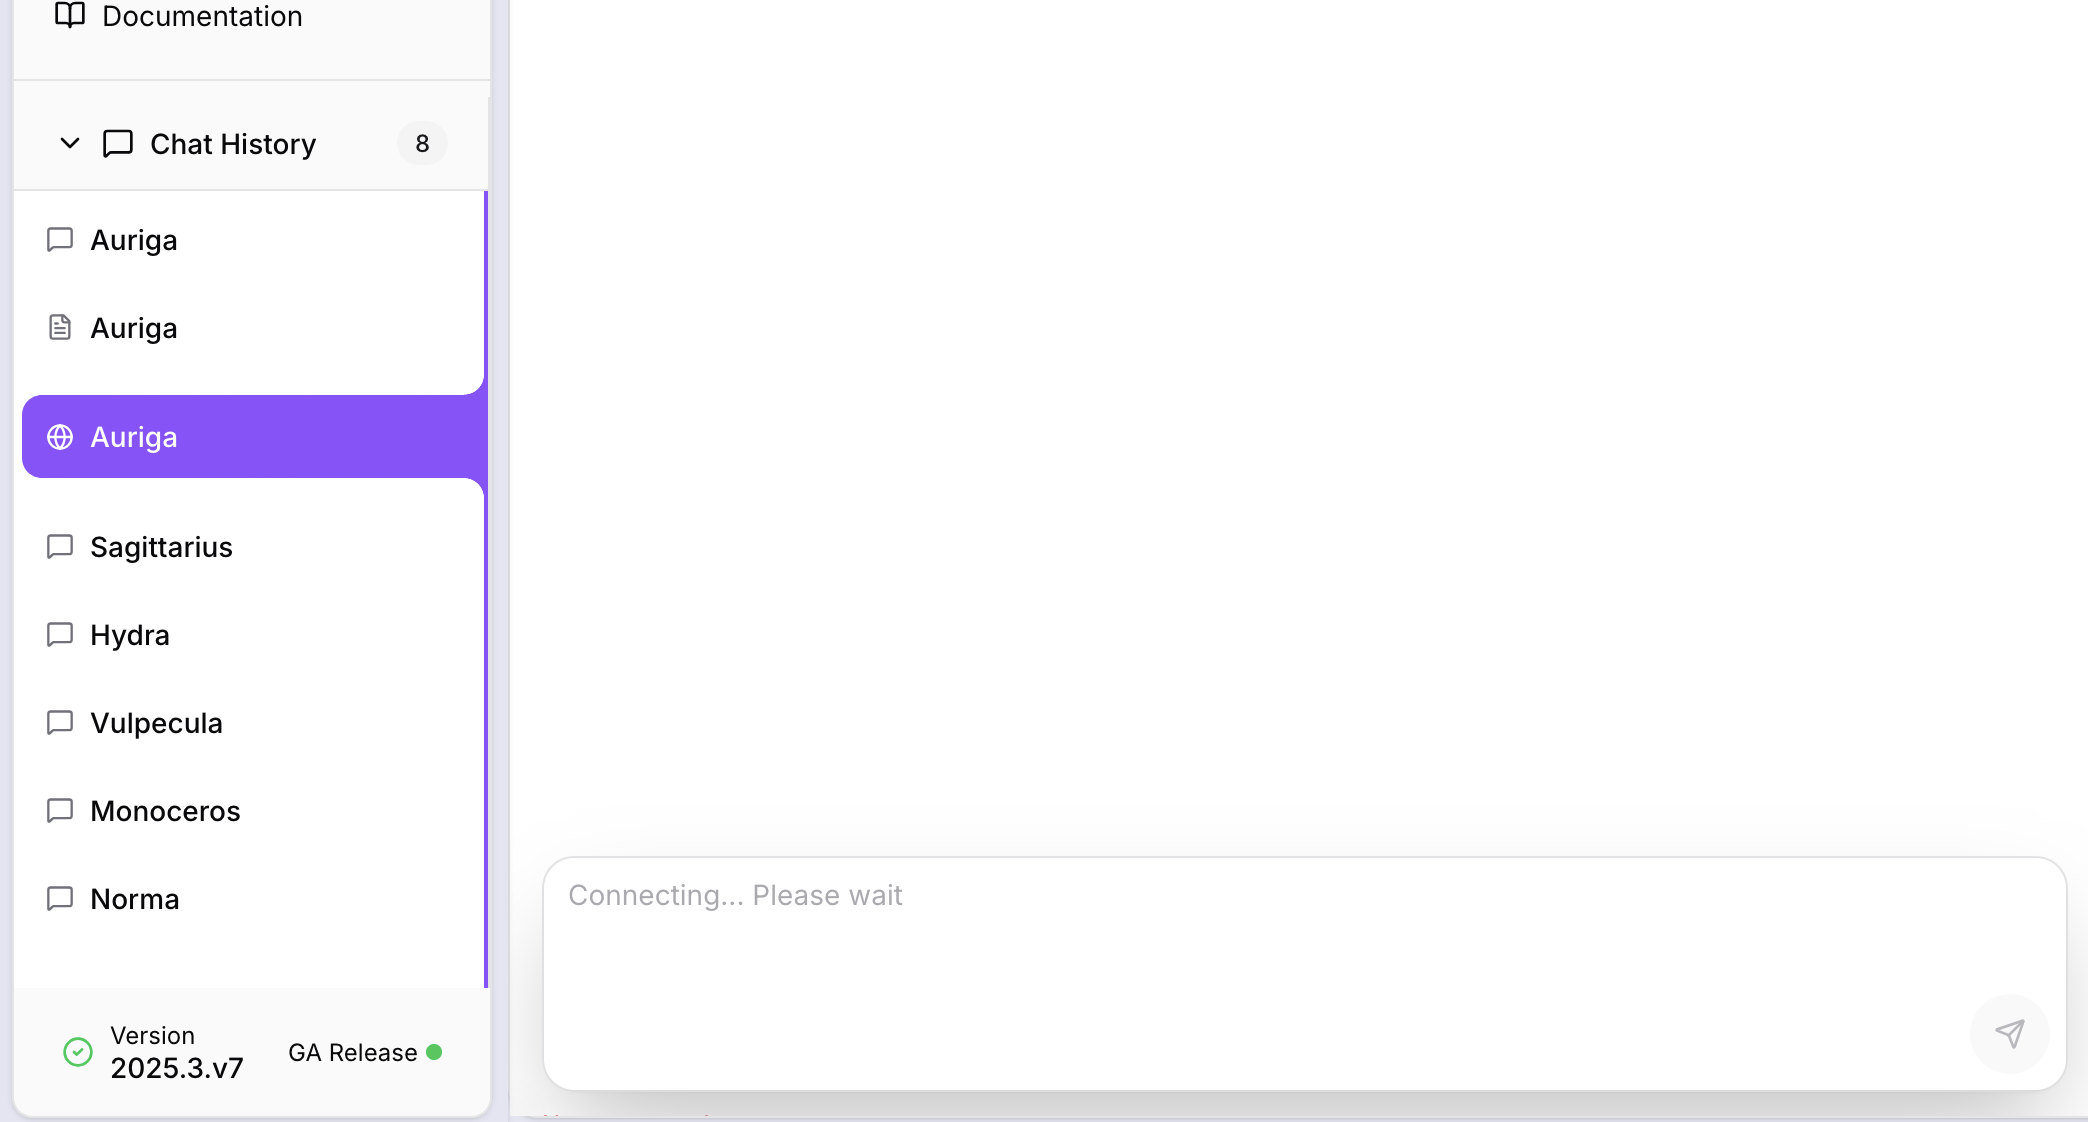
Right-click or use the session menu to Rename or Delete a session. The history shows the session type with a small icon — a globe icon for web-based sessions, a document icon for file-based sessions, and a plain chat bubble for standard database sessions.
Saving to a Notebook
Click the save icon on any response to add it to a notebook. You can save to an existing notebook or create a new one. Notebooks are accessible from the Data Explorer home screen and let you collect key findings across sessions.
Be specific for better results. Instead of "show me sales data", try "show me monthly sales by region for Q1 2024". The more context you give, the more precise the answer.